Visualize Relationships with Venn Diagram V2
Product Description
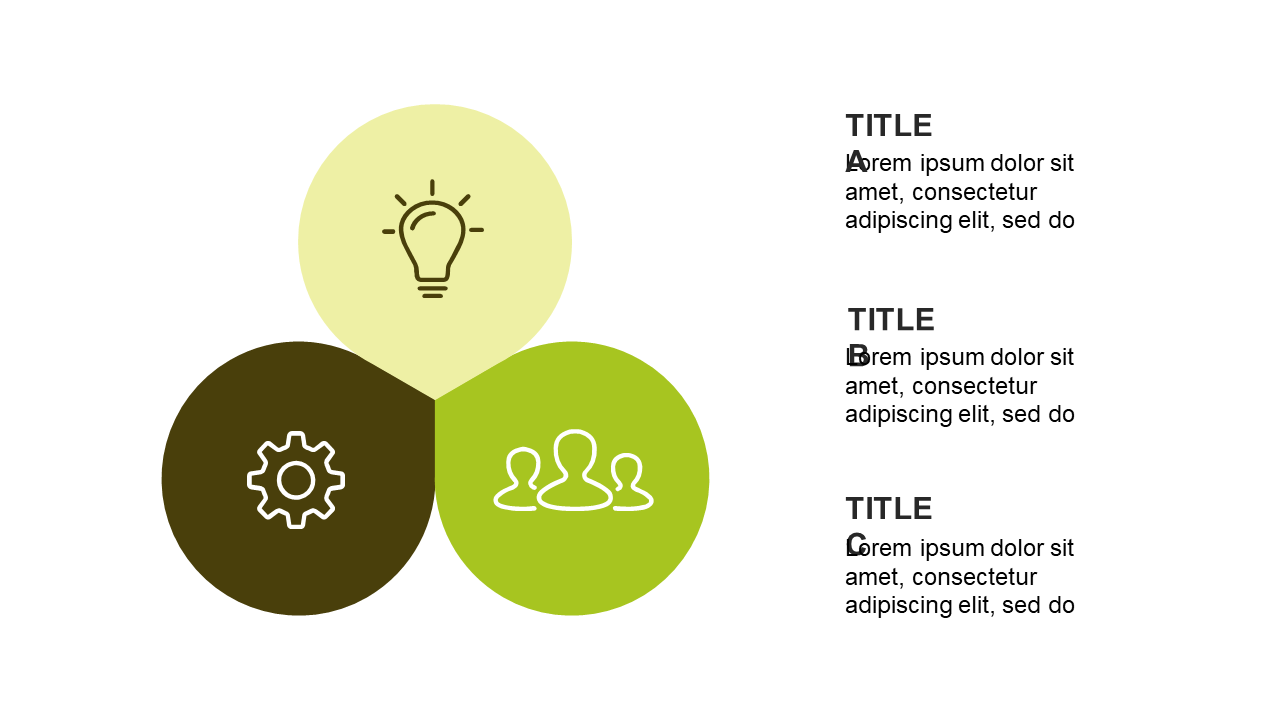
Trying to convey complex relationships can be a challenge, especially when your audience struggles to see the connections between different ideas. A Venn diagram is a straightforward yet effective way to visualize the overlapping concepts that matter most in your discussion. It breaks down the complexity and makes it accessible for everyone involved.
Ideal for marketing analysts preparing reports or project managers collaborating in brainstorming sessions, this diagram helps clarify how different strategies intersect. Whether you’re mapping out product features or comparing target demographics, this slide is your go-to tool for making those relationships clear and engaging.
For just $0.99, you can download this slide and start editing it immediately. It’s compatible with both PowerPoint and Google Slides, so
you can customize the icons and text to fit your specific needs in no time.
$0.99 – Purchase Checkout
Added to cart







