Present Target Demographics and Salary Insights

Product Description
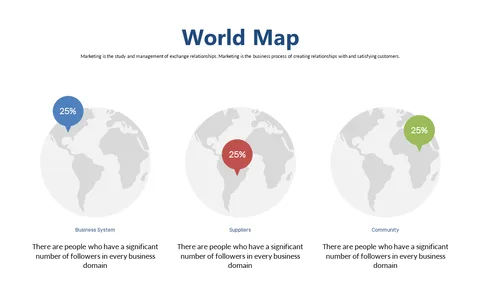
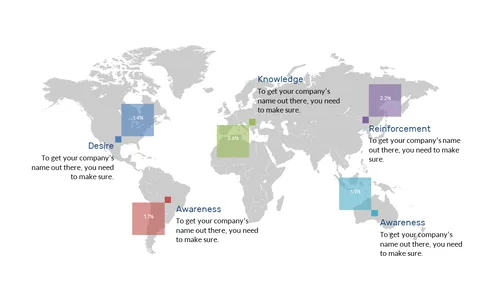
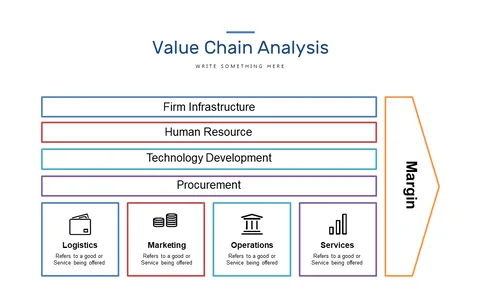
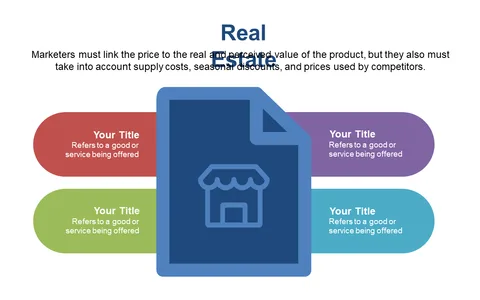
Without a solid understanding of your audience, crafting an effective strategy can be challenging. If you need to present complex demographic data in a digestible way, this slide offers a visually appealing infographic layout that highlights essential insights.
It helps you communicate key demographics effortlessly, ensuring your strategy development is informed and targeted. This slide is perfect for market researchers, business analysts, or product managers who need to present findings to clients or executives. Whether you’re discussing product launches, market entries, or customer profiles, this visual aid will help you convey your message with clarity and impact.
Available for just $0.99, this slide is an easy download and can be edited in PowerPoint or Google Slides. Get started on your data presentation quickly and effectively with this engaging slide.
$0.99 – Purchase Checkout
Added to cart