Visualize Stakeholder Interactions with Overlapping Circles
Product Description
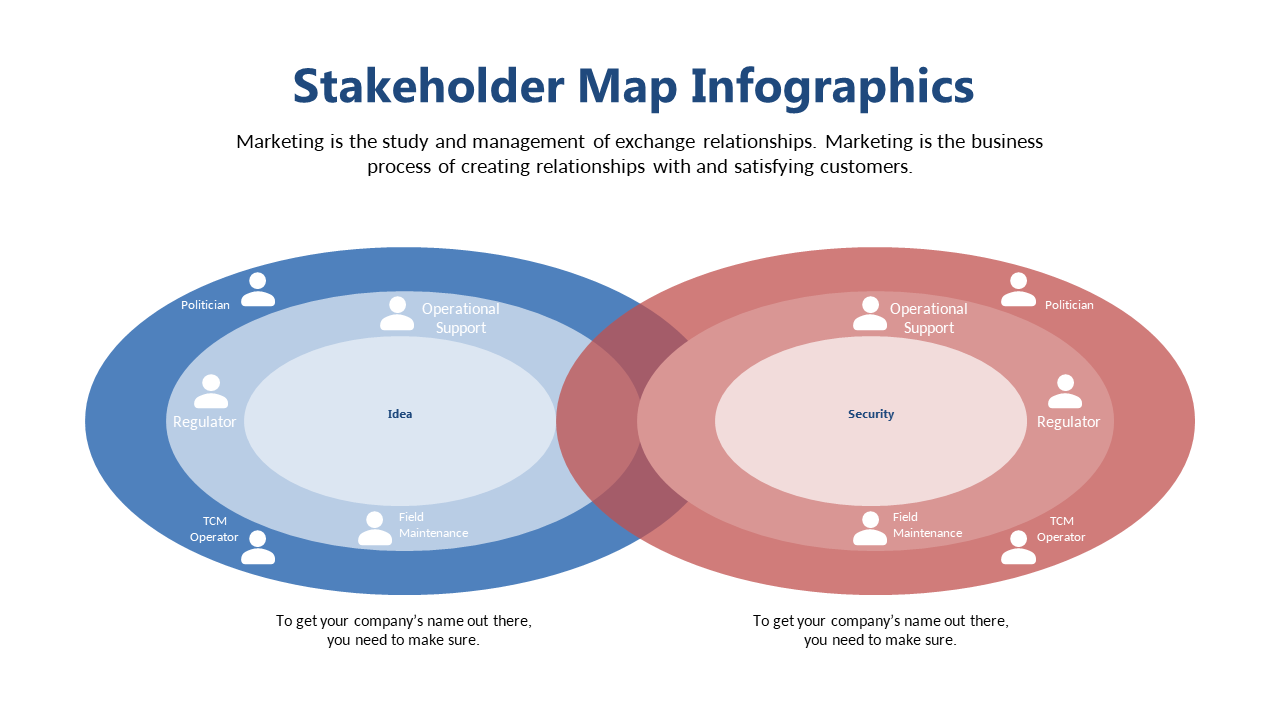
Understanding how different stakeholder groups interact can be a complicated puzzle, often leading to confusion during discussions. This slide, featuring overlapping circles, offers a clear representation of those relationships, making it simple for your audience to visualize how these groups connect and collaborate.
Project managers and team leaders can effectively use this slide in status meetings or stakeholder briefings, as it helps clarify the interconnectedness of various roles. With this visual aid, you can foster a better understanding of how each group contributes to the project’s success.
You can grab this slide for just $0.99, and it’s available for instant download. It’s fully editable in PowerPoint and Google Slides, allowing you to customize it quickly to suit your presentation style.
$0.99 – Purchase Checkout
Added to cart







