Showcase Engagement Metrics with Horizontal Bars
Product Description
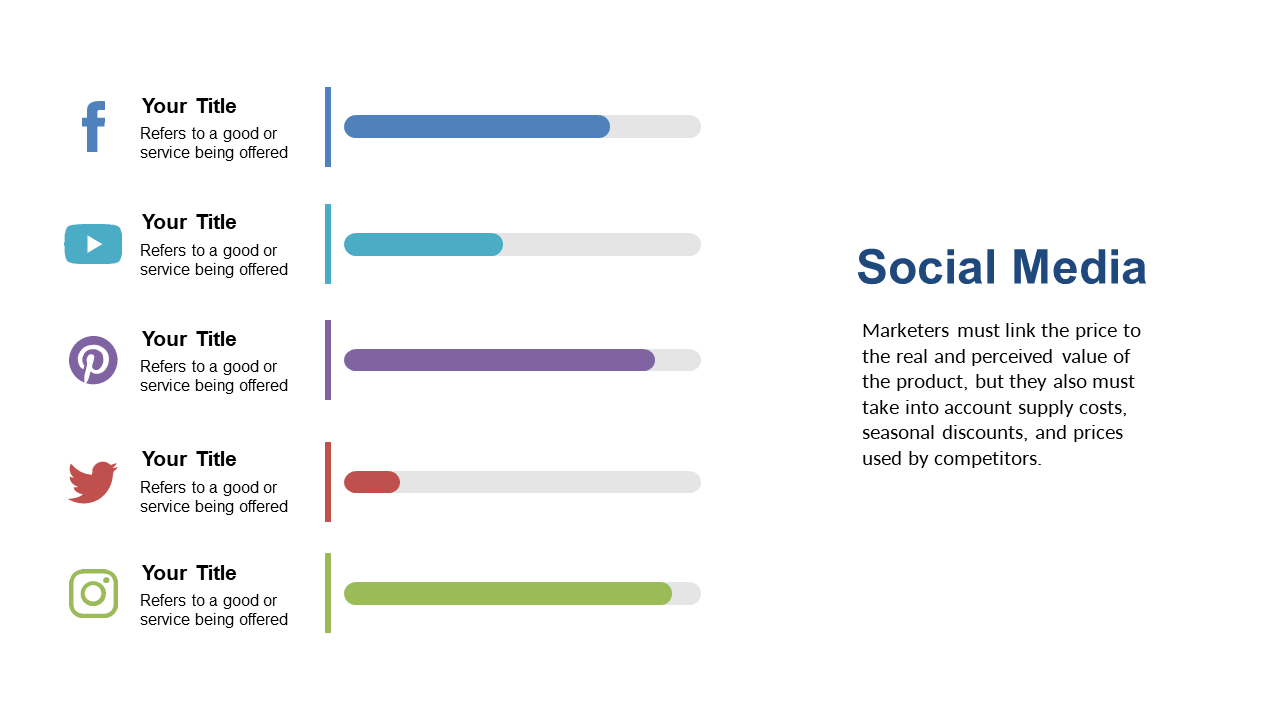
When it comes to presenting engagement metrics, clarity is key; without it, your data can easily lose its persuasive power. This horizontal bar slide transforms dense information into a straightforward visual, ensuring your audience stays engaged and understands the implications of the data.
Chief Marketing Officers, data analysts, and digital marketers will find this slide especially useful during performance reviews, stakeholder meetings, and strategy discussions. It helps you convey critical metrics in a way that resonates, making your arguments stronger and more convincing.
Available for just $0.99, this slide is readily downloadable, and you can tweak it within PowerPoint or Google Slides to fit your branding and content perfectly. Get your message across clearly and efficiently in no time.
$0.99 – Purchase Checkout
Added to cart







