Compare Real Estate Values with Balance Scale Layout
Product Description
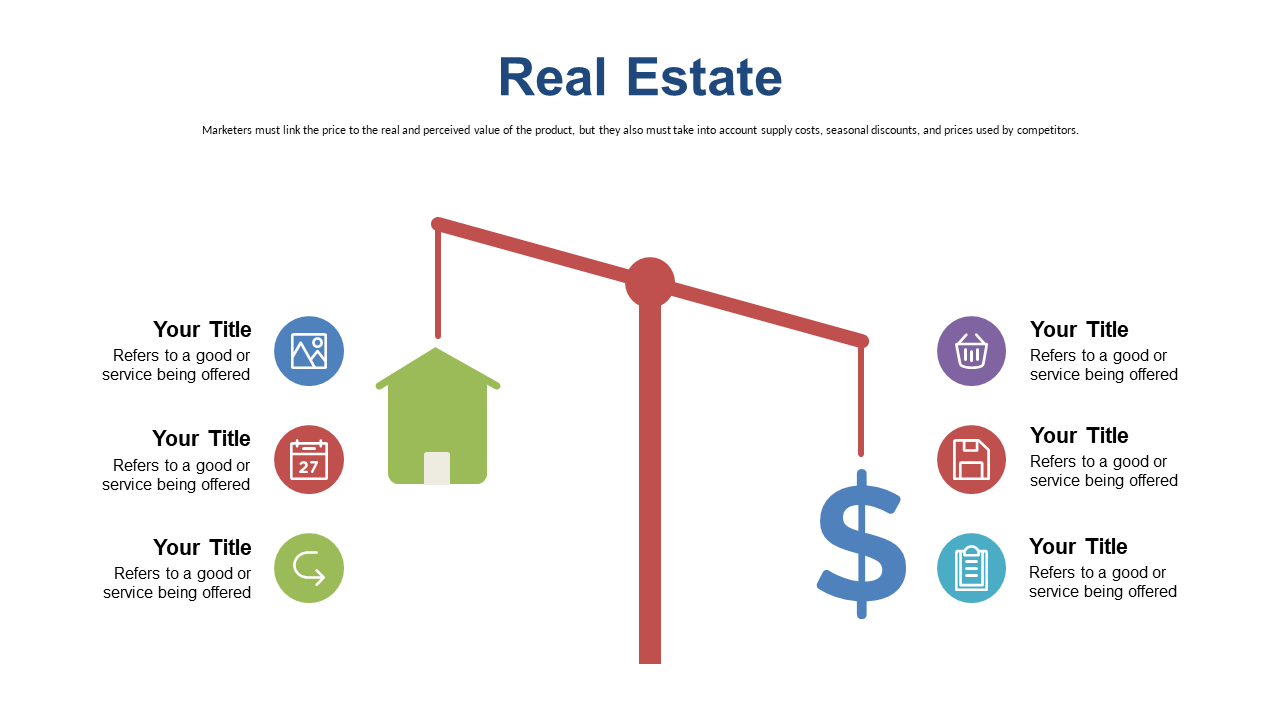
When you’re trying to make sense of varying real estate values, clear communication is essential. This slide presents a balance scale layout that simplifies complex comparisons, allowing you to convey differing property offerings in an easily digestible format.
It addresses the challenge of making numerical data visually engaging. Market analysts, real estate appraisers, and investment advisors can utilize this slide during financial presentations, appraisal meetings, or market analysis discussions. By showcasing property values side by side, you can engage your audience effectively and make data-driven arguments that resonate.
For only $0.99, this slide is available for instant download and is fully editable in PowerPoint and Google Slides. With just a few tweaks, you can turn it into a visually compelling part of your next presentation.
$0.99 – Purchase Checkout
Added to cart







