Communicate Sales Stages with a Color-Coded Funnel
Product Description
Keeping track of where prospects are in your sales pipeline can be a tricky task. Misunderstandings about sales stages can lead to missed opportunities and frustrated teams.
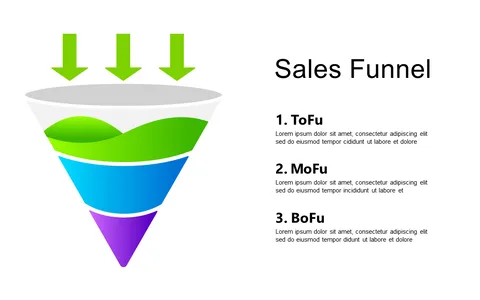
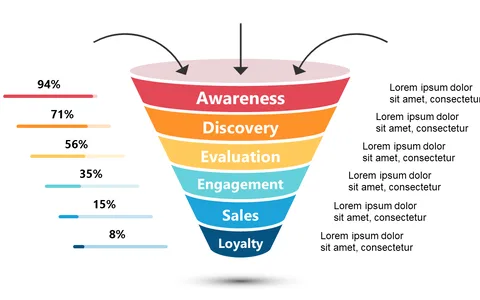
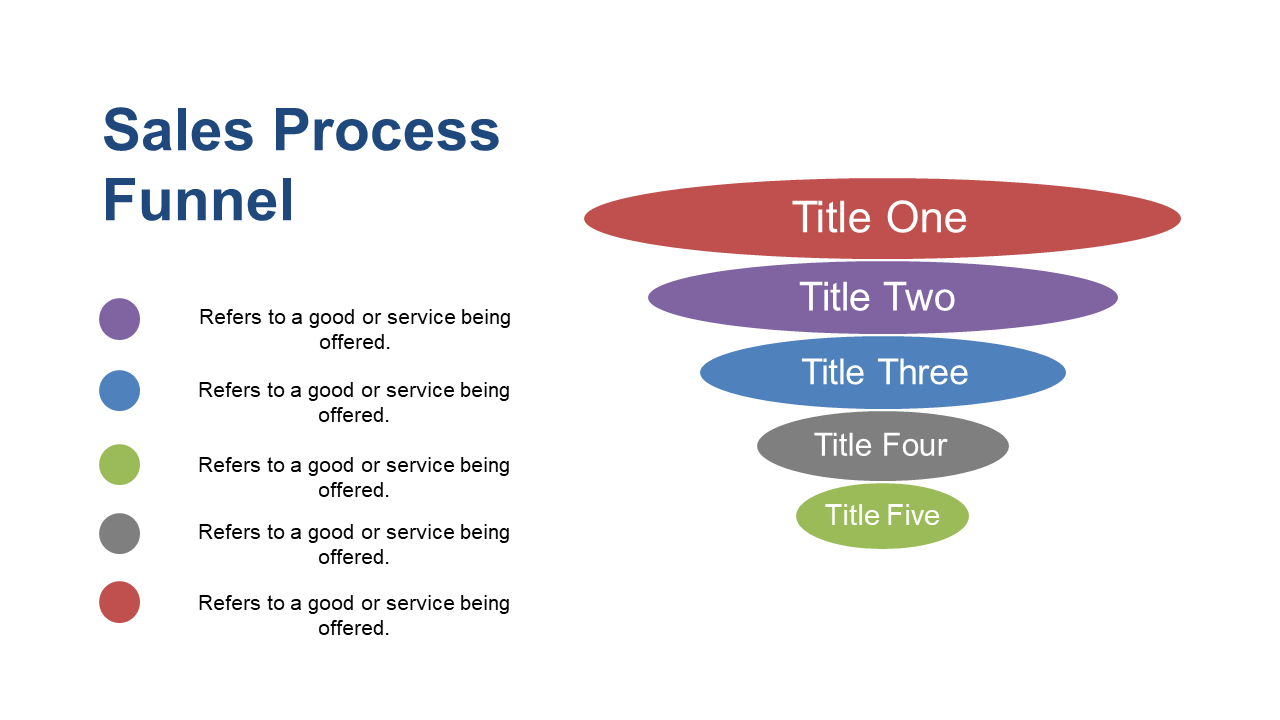
This slide addresses that issue with a color-coded funnel diagram that simplifies the sales process and makes it easy for everyone to see where each prospect stands. Sales managers, account executives, and marketing teams will find this slide especially helpful during sales meetings, strategy sessions, or client presentations. It’s designed for anyone who needs to explain complex sales stages clearly, whether you’re reviewing quarterly performance or aligning your team on new tactics.
For just $0.99, you can instantly download this slide and edit it to fit your needs in PowerPoint or Google Slides. It’s simple to customize, so you can add your details and start impressing your audience in no time.
$0.99 – Purchase Checkout
Added to cart