Highlight Sales Phases with Funnel Metrics
Product Description
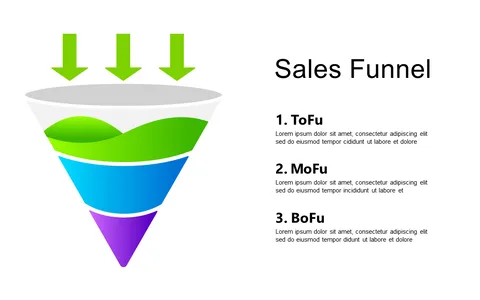
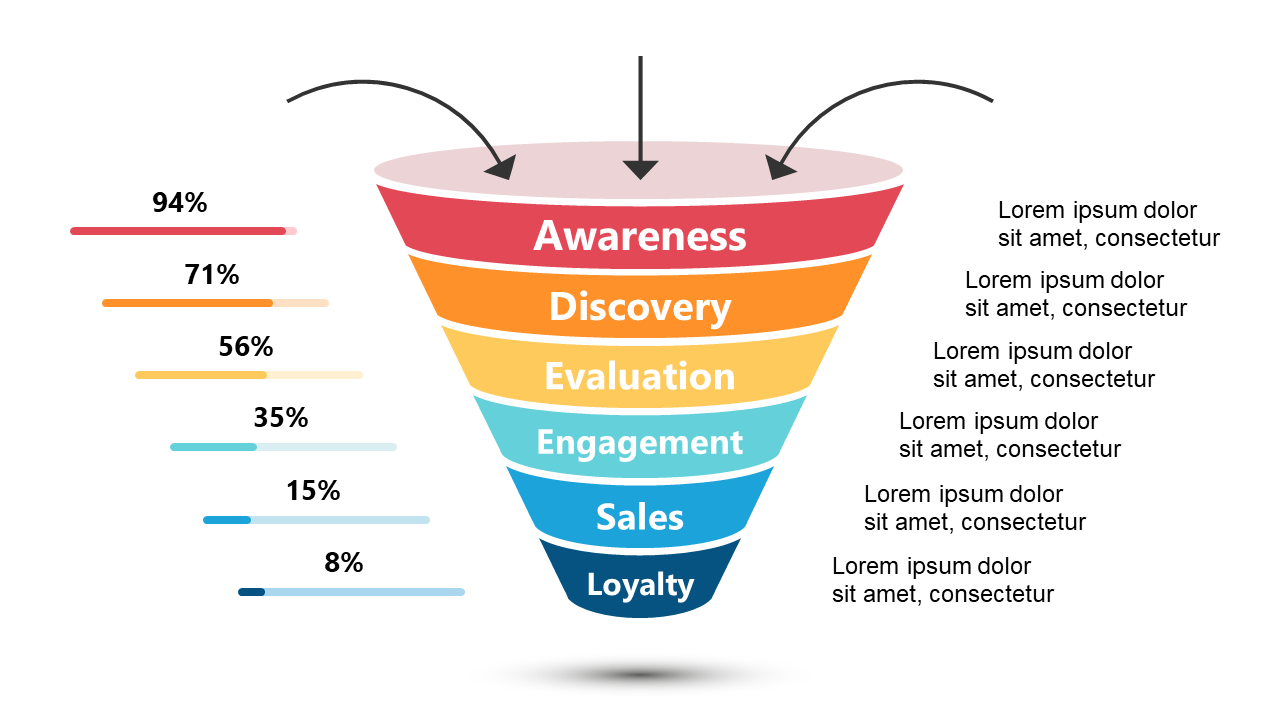
Making sense of sales funnel metrics can be overwhelming, especially when you need to communicate key conversion rates. Misunderstandings at any stage of the funnel can lead to missed opportunities and unclear strategies. This slide simplifies that conversation by presenting the funnel stages in a clear, visually appealing format.
Ideal for sales managers, marketing specialists, and business development teams, this slide is designed for presentations that analyze sales strategies or performance metrics. Use it in quarterly reviews, sales training sessions, or strategic planning meetings to ensure everyone is on the same page about where improvements are needed.
Available for just $0.99, this slide is a quick download that
you can easily customize in PowerPoint or Google Slides. Tailor the text and colors to match your brand and have a professionally polished presentation ready in no time.
$0.99 – Purchase Checkout
Added to cart