Analyze Sales Process with Funnel Metrics

Product Description
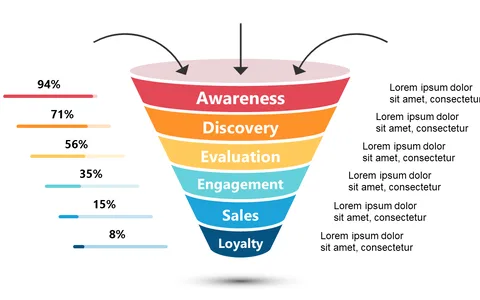
Analyzing your sales process can be daunting when you need to focus on the details that drive your strategy. It’s easy to get lost in the numbers and forget to show the direct flow of your sales funnel.
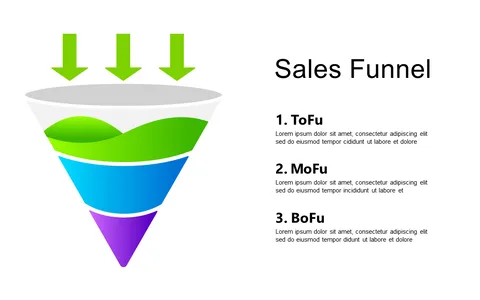
This slide simplifies that task with a clear visual of each funnel stage, helping you to communicate conversion rates clearly and effectively. Sales teams and marketing professionals will find this slide essential during strategy sessions, performance reviews, or training workshops. Whether you’re a sales director examining last quarter’s performance or a marketing analyst presenting campaign outcomes, the funnel metrics will help you identify areas for improvement and align your team.
Available for just $0.99, this slide is ready for immediate download and can be easily edited to fit your specific data in PowerPoint or Google Slides. Get it now and start analyzing your sales process with clarity and confidence.
$0.99 – Purchase Checkout
Added to cart