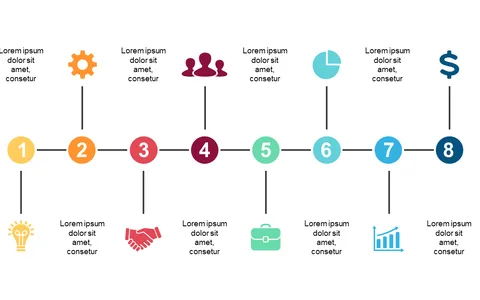
Rounded Steps Layout for Clear Process Presentation

Product Description
It can be challenging to present a complex process clearly and engagingly, especially when your audience struggles to keep track of each step. This layout uses rounded shapes to create a visually appealing flow, ensuring your audience remains focused and understands the progression of ideas.
This slide is ideal for project managers leading cross-functional teams, educators giving lessons on methodologies, or business analysts developing reports on procedural improvements. Whether you’re mapping out a project timeline or showing a customer journey, this layout helps you communicate your process effectively.
For just $0.99, you can download this slide instantly. It’s easy to edit in PowerPoint or Google Slides, so you’ll be ready to present in minutes.
$0.99 – Purchase Checkout
Added to cart