Communicate Ideas with Rounded Icon Text Boxes
Product Description
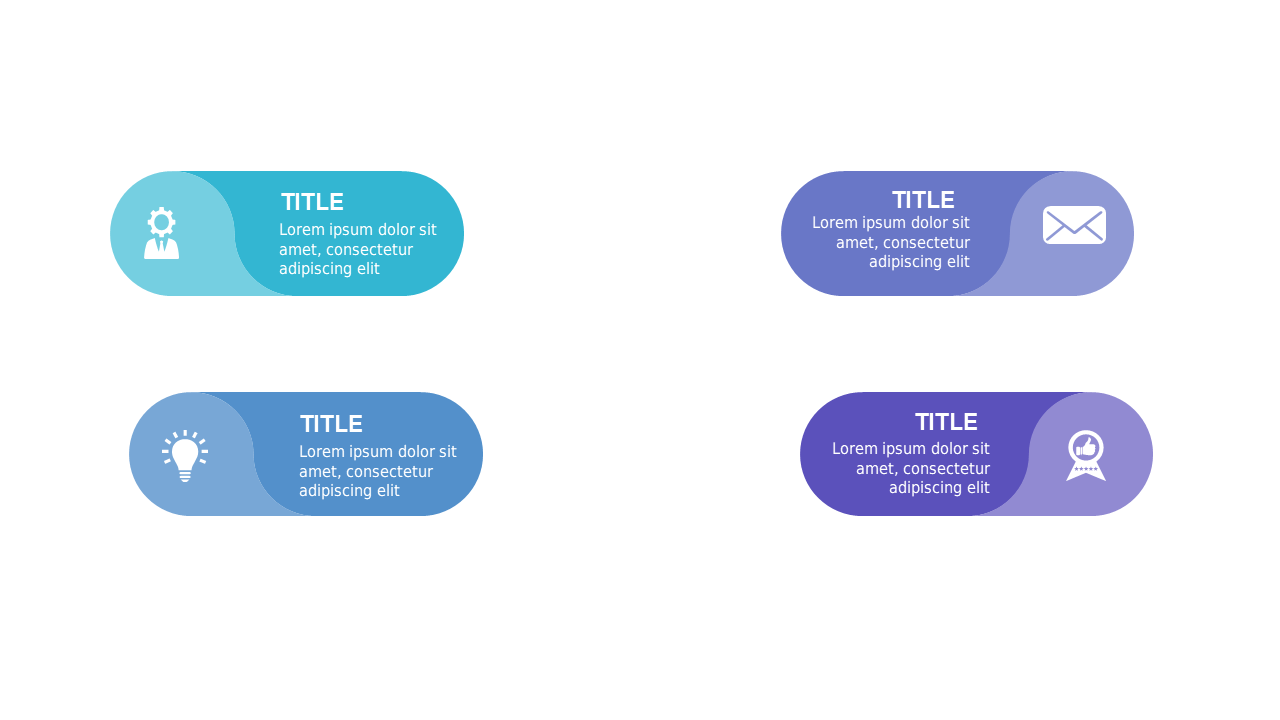
Struggling to get your point across in a way that keeps your audience engaged? Dense text and complicated charts can be overwhelming, making it tough for your message to stick. With rounded icon text boxes, this slide provides a fresh, visually engaging approach that simplifies communication and helps you convey your ideas effectively.
This slide is perfect for marketing professionals pitching a new campaign or finance analysts presenting quarterly results. Use it in workshops, client meetings, or team briefings where clarity and engagement are crucial.
The combination of visuals and text boxes ensures your audience doesn’t just listen, but they truly understand your message. At just $0.99, this slide is ready for instant download and is easy to edit in both PowerPoint and Google Slides. You’ll be able to customize it to fit your needs in minutes, making it a fantastic addition to your presentation toolkit.
$0.99 – Purchase Checkout
Added to cart







