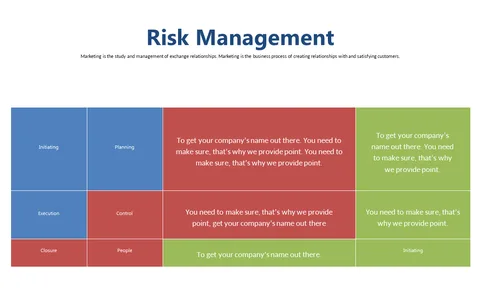
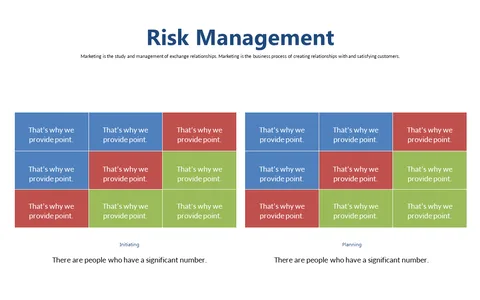
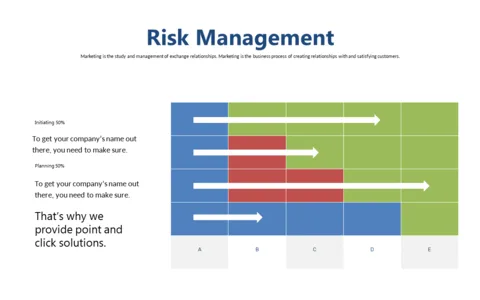
Effective Risk Management Visualization with Matrix
Product Description
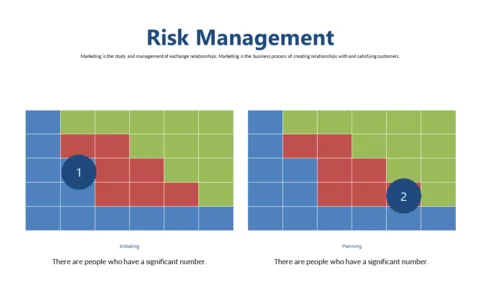
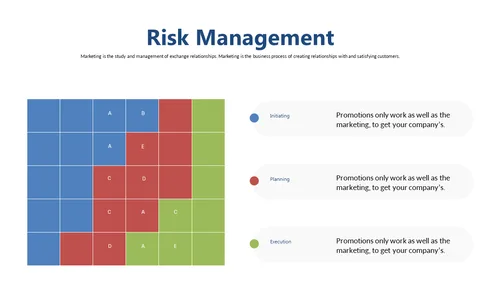
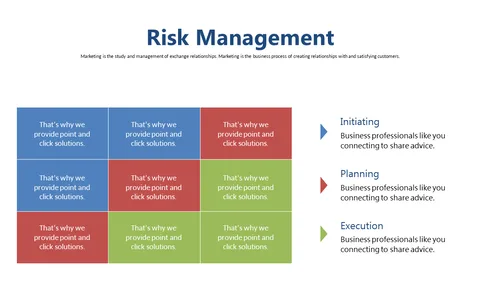
When juggling multiple projects, conveying risk management effectively can feel like a balancing act. You need a method to share vital information that helps your team understand the varying phases without causing confusion.
This matrix slide offers a crisp visual representation that simplifies complex risk data across several phases. This slide is a great fit for project managers, risk assessment teams, and business leaders who need to communicate risk status in team meetings or project reviews. Use it to highlight specific tasks and priorities clearly, ensuring your team can act quickly and confidently.
For just $0.99, you can instantly download this slide, fully editable in PowerPoint and Google Slides. Customize it as needed to fit your project details, making your presentations clearer and more impactful in no time.
$0.99 – Purchase Checkout
Added to cart