Visualize Risk Management Phases with Editable Matrix

Product Description
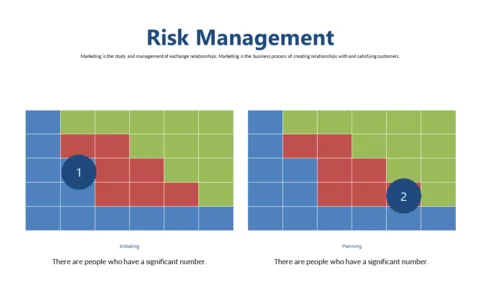
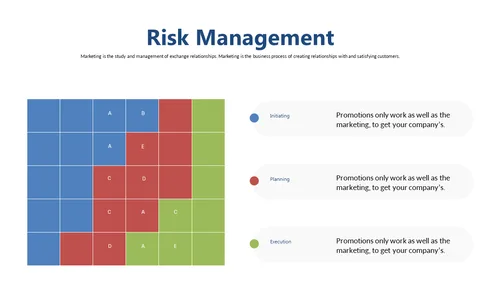
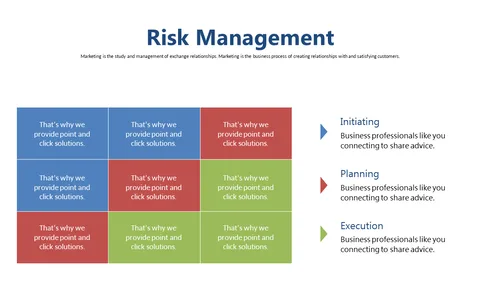
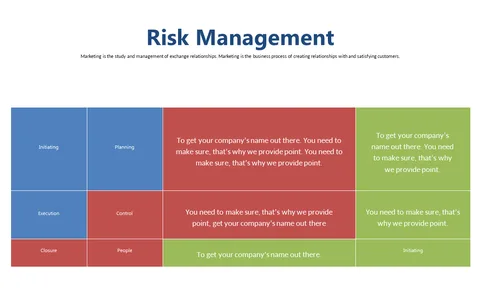
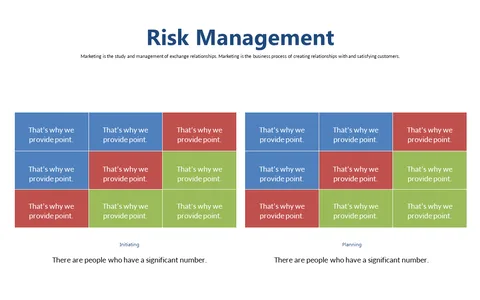
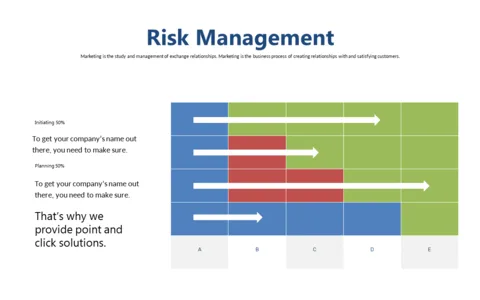
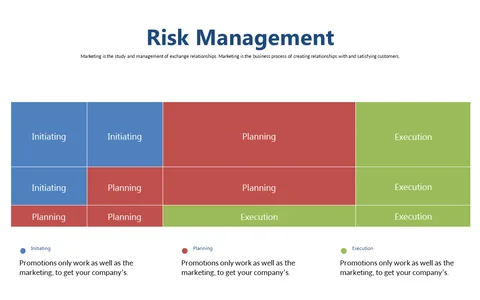
Finding clarity in the risk management process can sometimes feel like trying to navigate a maze. This editable matrix slide simplifies that journey by outlining phases like Initiating, Planning, and Execution in a visually appealing layout.
It turns the complexity of risk management into something more digestible for your audience. This slide is perfect for business analysts, project managers, and team leaders who need to present risk assessments during meetings or stakeholder updates. Whether you’re in tech, construction, or any fast-paced industry, being able to visualize risk phases can enhance your communication with team members and clients alike.
For just $0.99, you can instantly download this slide and make it your own in PowerPoint or Google Slides. With its editable format, you’ll be ready to customize it to fit your needs in no time.
$0.99 – Purchase Checkout
Added to cart