Assess Risk Management with Color-Coded Matrix

Product Description
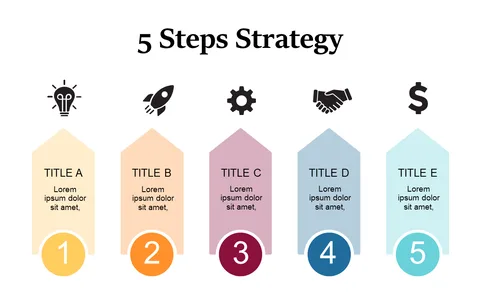
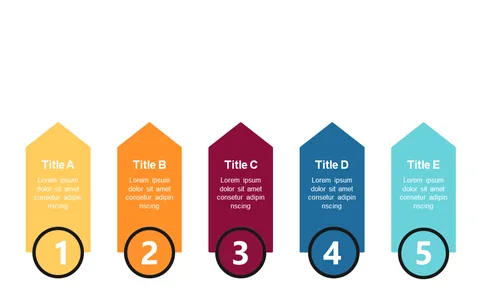
In a fast-paced business landscape, figuring out how to assess risk effectively can be daunting. This color-coded matrix slide brings clarity to the phases of risk management, including Initiating, Planning, Execution, and Control, allowing you to present your information in an easily understandable format.
Ideal for business strategists, project managers, and risk assessors, this slide is particularly valuable for strategy sessions or risk assessment meetings. Whether you’re in finance, healthcare, or technology, having a visual tool to demonstrate risk phases ensures everyone understands the assessment process.
At just $0.99, this slide can be downloaded instantly. It’s easy to edit in PowerPoint or Google Slides, so you can make your presentation shine without spending hours customizing.
$0.99 – Purchase Checkout
Added to cart