Illustrate Pricing Perception Factors in Real Estate
Product Description
Effectively conveying pricing perception is essential in real estate, yet many professionals struggle to illustrate the factors that influence it. You want potential clients to understand how various elements shape property value, but finding the right way to present this information can be tricky.
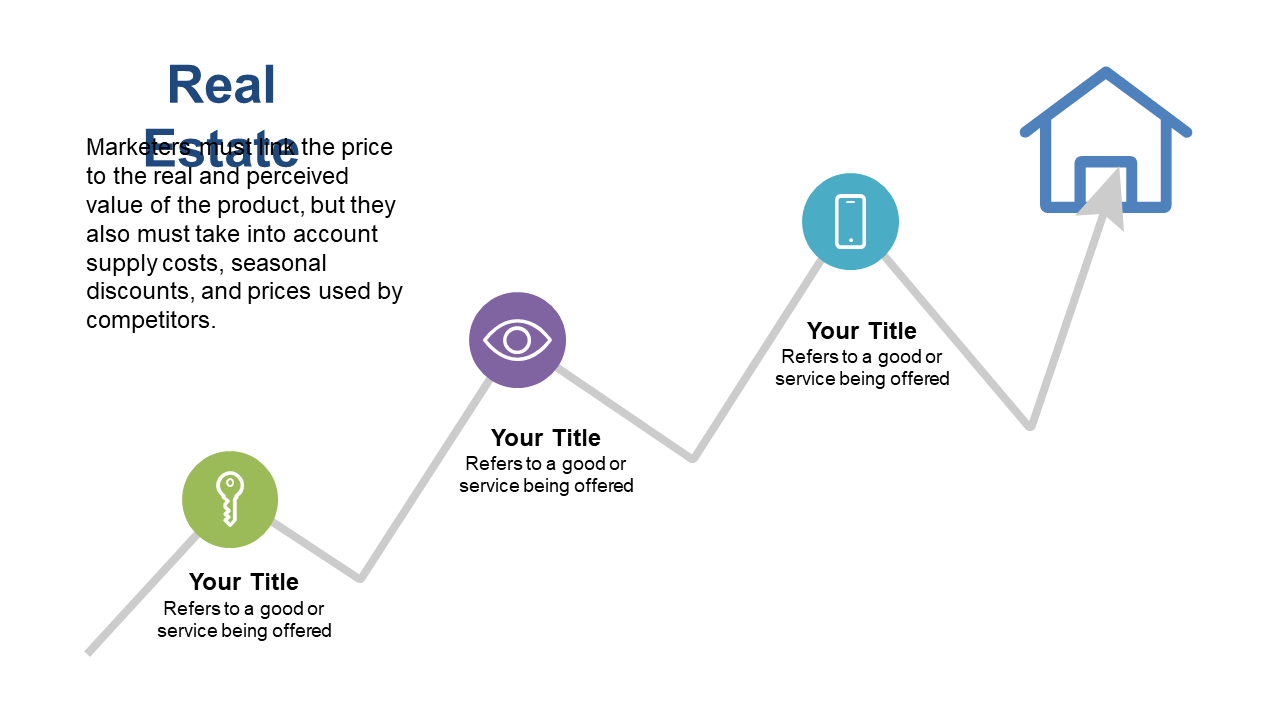
This slide offers a visual flow chart that organizes these components clearly and concisely. Marketing managers, sales agents, and property evaluators can utilize this slide in client consultations or presentations to demystify pricing strategies. It’s also beneficial for real estate firms preparing training materials or market analysis reports to help their teams understand valuation perceptions better.
For only $0.99, this slide is available for instant download. It’s fully editable in both PowerPoint and Google Slides, allowing you to customize it to your needs and be presentation-ready in no time.
$0.99 – Purchase Checkout
Added to cart







