Analyze Real Estate Pricing Strategies Effectively
Product Description
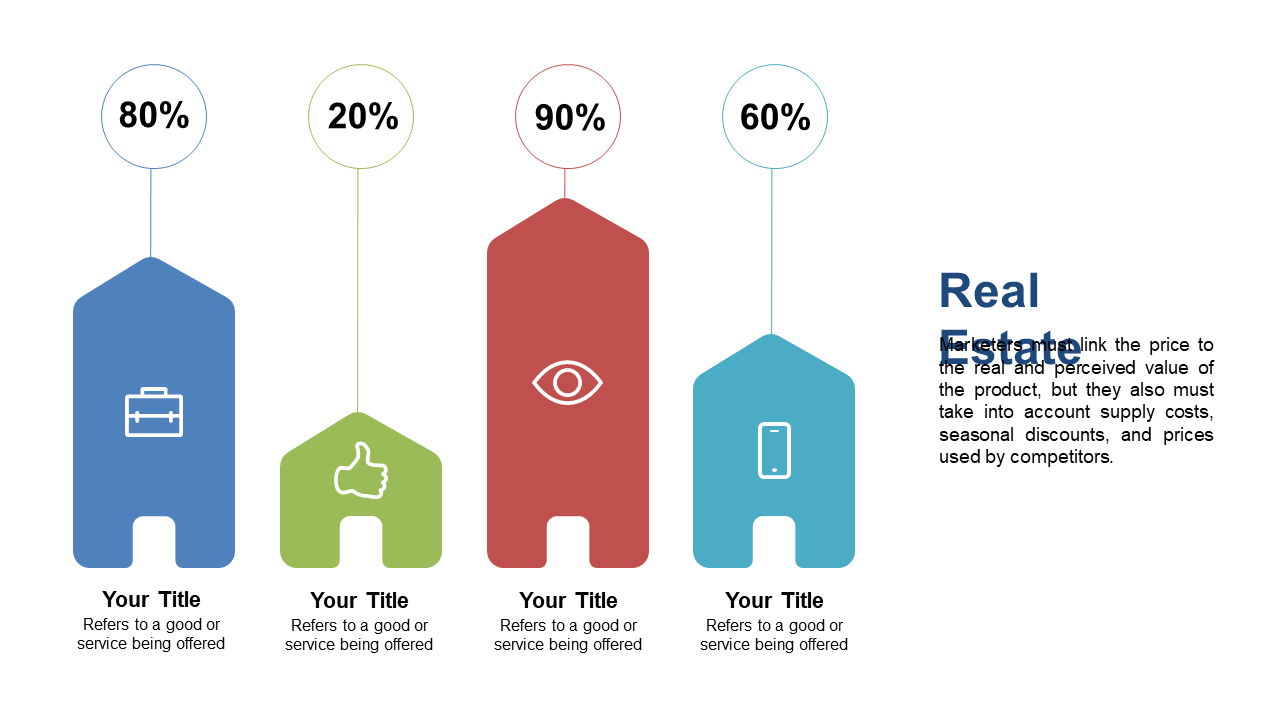
Navigating the complexities of real estate pricing can feel overwhelming, especially when trying to present multiple strategies clearly. This slide simplifies the comparison of perceived versus actual value with intuitive icons and percentage indicators, making your analysis straightforward and visually engaging.
Real estate agents, market analysts, and financial advisors will find this slide indispensable for meetings where pricing strategies are discussed.
Whether you’re presenting to a team of investors or leading a workshop on market trends, this slide will help you communicate your insights effectively. Available for just $0.99, this slide is ready for instant download and can be easily edited in PowerPoint and Google Slides, allowing you to tailor it to your specific needs in minutes.
$0.99 – Purchase Checkout
Added to cart







