Analyze Real Estate Market with Magnifying Glass Layout

Product Description
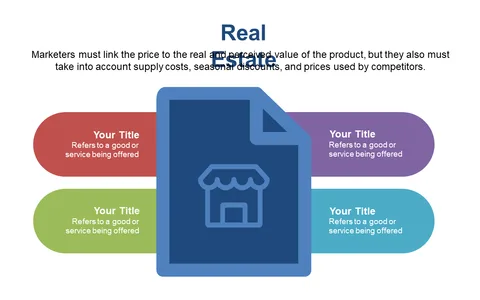
Navigating the overwhelming sea of data in the real estate market can easily lead to confusion for both you and your audience. This slide addresses that problem head-on by focusing attention on essential insights through a striking magnifying glass design.
It transforms complex information into clear, digestible visuals that make your analysis stand out. Market analysts, real estate consultants, and business development executives will find this slide invaluable for presenting research findings, competitive analyses, or client reports. Whether you’re delivering a quarterly review or pitching to investors, this layout allows you to spotlight the most critical market insights with clarity and impact.
Available for just $0.99, this slide is ready for immediate download and can be edited in PowerPoint or Google Slides. You’ll be able to make adjustments and customize your presentation quickly, ensuring you’re prepared in no time.
$0.99 – Purchase Checkout
Added to cart