Explore Real Estate Insights with Magnifying Glass Design

Product Description
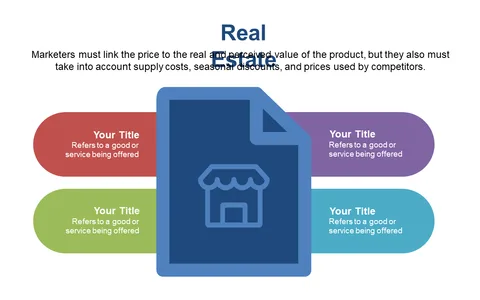
Keeping track of market trends in real estate can be a real challenge, and making sense of intricate data sets can leave your audience lost. This slide helps tackle that challenge by employing a striking magnifying glass design that directs focus on the key insights.
It visually simplifies complex data, making it easier for everyone to grasp the important details. Real estate analysts, property managers, and market researchers will find this slide particularly useful for team meetings, trend analysis sessions, or client presentations. It serves as a valuable tool to showcase essential information and trends, ensuring your message resonates with your audience.
For only $0.99, you can download this slide instantly, and it’s fully editable in PowerPoint and Google Slides. Customize it to fit your unique style and needs in just a few minutes.
$0.99 – Purchase Checkout
Added to cart