Analyze Real Estate Market Dynamics Visually
Product Description
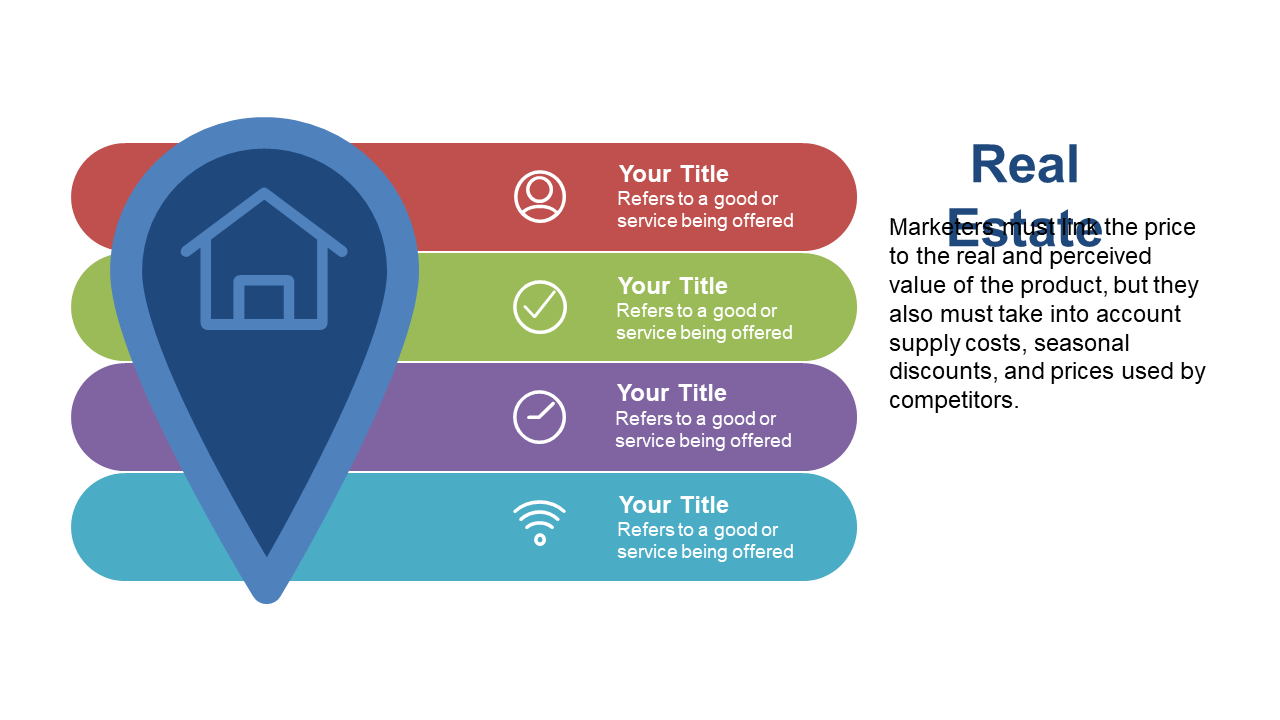
Analyzing real estate market trends can often feel like piecing together a complicated puzzle. With so much data to sort through, it’s easy to become overwhelmed, which can leave your audience disengaged and confused. This slide distills complex market dynamics into an eye-catching visual that helps present data clearly.
Real estate agents, market analysts, and developers can all benefit from this slide during strategy meetings or market analysis presentations. It works perfectly for showcasing trends in local markets when pitching to investors or when outlining competitive advantages in a market overview.
Whether you’re leading a team meeting or presenting to potential buyers, this slide helps ensure your data resonates. For just $0.99, you can instantly download this slide, making it easy to customize in both PowerPoint and Google Slides. Editing is a breeze, allowing you to tailor it to your specific needs within minutes.
$0.99 – Purchase Checkout
Added to cart