Strategic Planning with Quadrant Cycle Diagram
Product Description
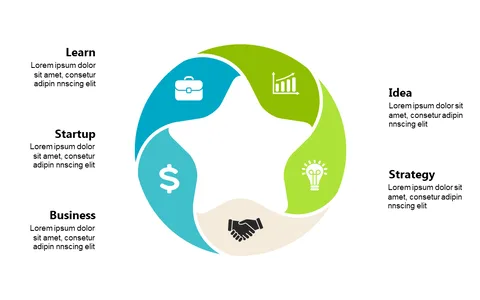
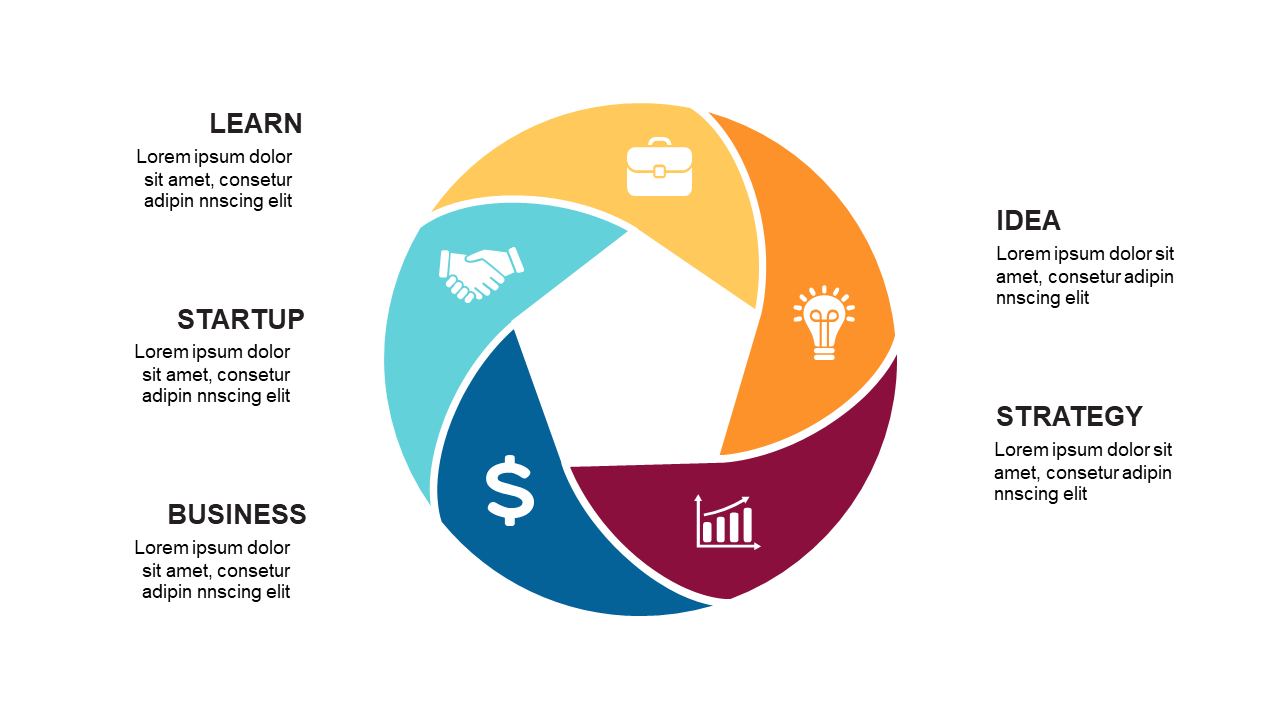
Strategizing can often feel overwhelming, especially when trying to convey complex ideas in a clear manner. This quadrant cycle diagram breaks down your strategy into manageable sections, allowing you to present key concepts with clarity and visual appeal to enhance your message.
This slide is perfect for business analysts or strategy consultants during executive meetings when presenting ideas related to business growth or development. It fits well in workshops focused on innovation or product roadmap discussions, helping your audience grasp intricate concepts quickly.
At just $0.99, this slide is an easy addition to your presentation toolkit. Download it now and edit it right in PowerPoint or Google Slides to make it truly your own in no time.
$0.99 – Purchase Checkout
Added to cart