Facilitate Market Comparison with Quadrant Analysis
Product Description
Presenting market analysis can be a daunting task, especially when you want to ensure that your audience grasps the complexities involved. With various factors at play, clear communication is essential.
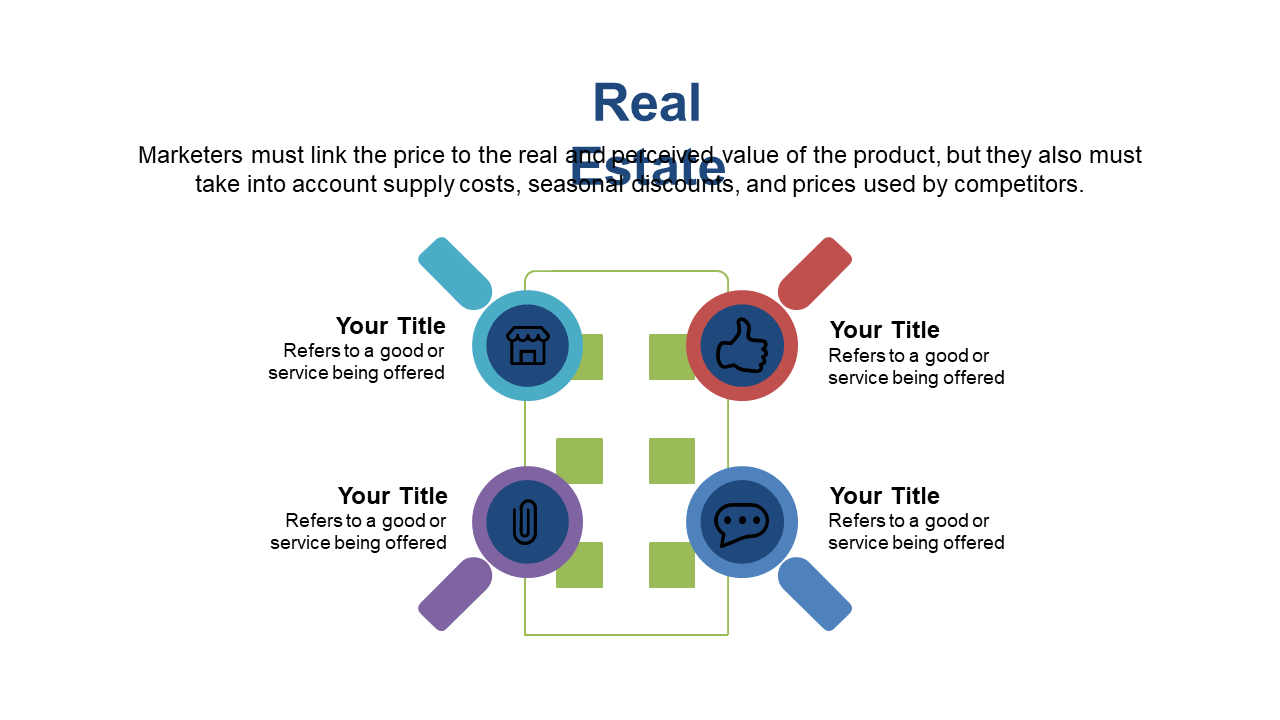
This slide simplifies that process with a quadrant layout to help you visually compare key aspects of your market research. Market analysts, real estate consultants, and sales strategists can leverage this slide in board meetings or client updates to present comparative analyses clearly. It’s also useful for research teams looking to communicate findings during strategy sessions or industry workshops.
You can get this slide for just $0.99 and enjoy instant download. It’s fully editable in both PowerPoint and Google Slides, making it easy to tailor the content to your specific findings and insights.
$0.99 – Purchase Checkout
Added to cart







