Engaging Puzzle Pieces for Project Management
Product Description
Conveying complex project information to stakeholders can sometimes feel like piecing together a puzzle. If your visuals aren’t engaging, you risk losing their interest or, worse, their understanding.
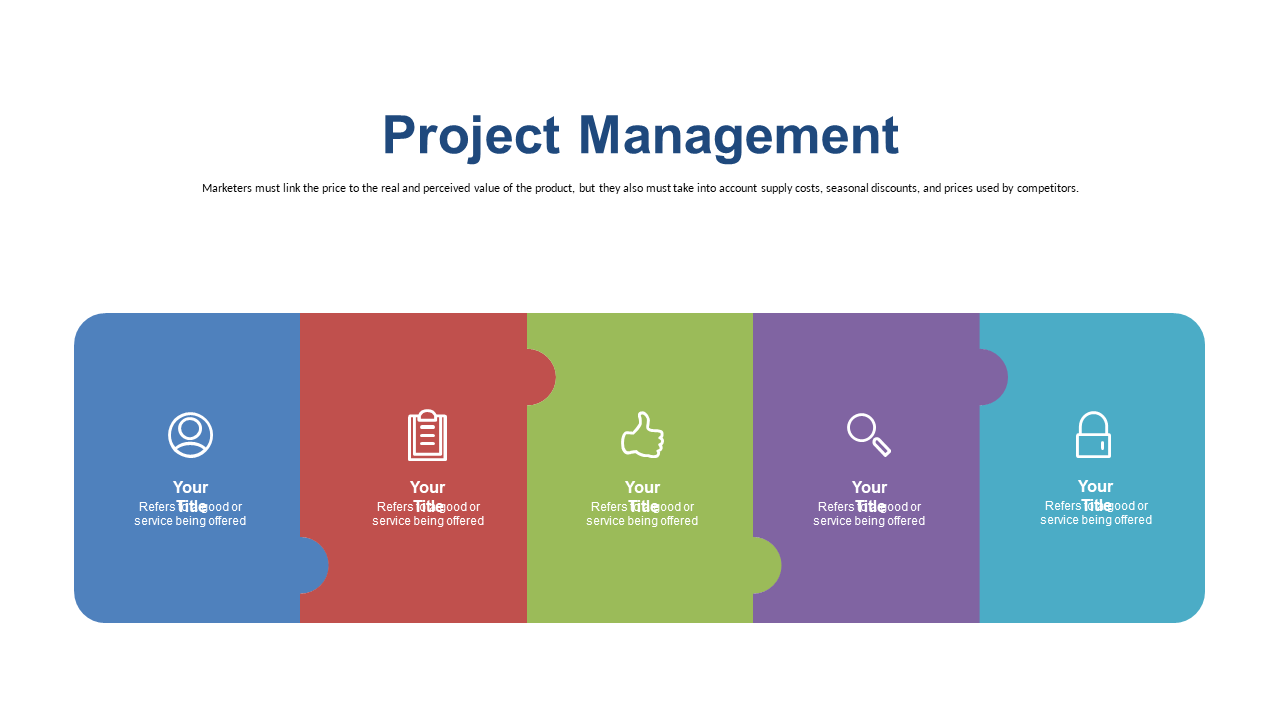
This slide provides a captivating representation of interconnected puzzle pieces, helping you illustrate how different elements of your project management framework fit together. Ideal for project managers, team leads, or anyone presenting project updates in industries such as technology, construction, or consulting, this slide can be used in team meetings or progress reports. It’s perfect for showcasing how various aspects of your project interconnect, keeping stakeholders engaged.
Available for just $0.99, you can download this slide and start customizing it immediately. It’s easy to edit in PowerPoint or Google Slides, allowing you to tailor your presentation’s visuals in a matter of minutes.
$0.99 – Purchase Checkout
Added to cart