Illustrate Strategy with Puzzle Piece Head Layout V5

Product Description
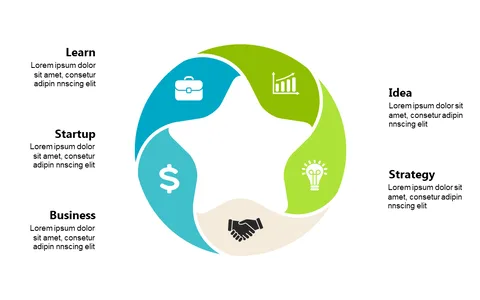
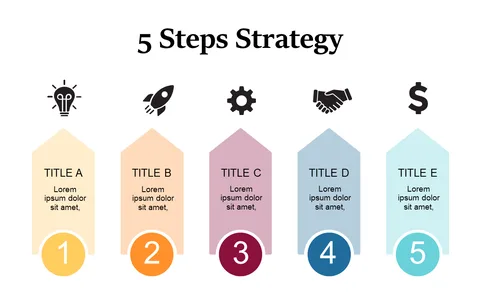
Communicating detailed strategies can sometimes come across as too complicated, leaving your audience lost in the details. This slide features a puzzle piece head layout that makes it easier to break down your strategy into manageable segments.
Each section is thoughtfully designed with icons, guiding your audience through the complexities of your presentation seamlessly. You’ll find this slide invaluable as a consultant, business analyst, or team leader presenting at strategy sessions or client meetings. It’s a fantastic tool for breaking down project timelines, performance metrics, or outlining new business models in a way that’s visually appealing and easy to digest.
Available for just $0.99, this slide can be downloaded instantly and allows you to make quick edits in PowerPoint or Google Slides. Get ready to present your strategies clearly and effectively within minutes.
$0.99 – Purchase Checkout
Added to cart