Present Customer Journey Stages with Funnel V2

Product Description
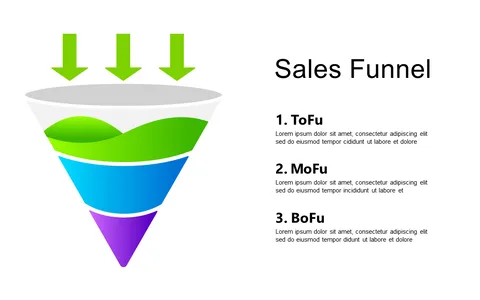
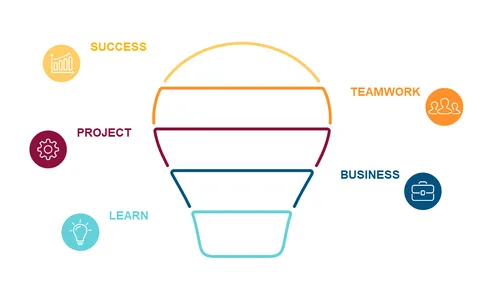
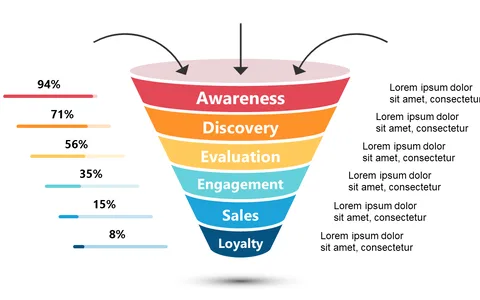
Understanding the customer journey is often challenging, especially when trying to align your team on the various stages customers experience. You need a clear visual to demonstrate how these stages connect. This slide provides a vibrant funnel design that clearly highlights each step customers take, making it easier for your audience to follow along.
Sales leads and business analysts can utilize this slide in strategy meetings, performance reviews, or training sessions. If you’re tasked with improving conversion rates or training new employees on the sales process, this visual representation will keep everyone on the same page.
It’s an effective way to break down the complexities of customer behavior. You can get this slide for only $0.99, allowing for quick access and immediate editing in PowerPoint and Google Slides. Customize it to meet your specific needs and enhance your presentations with ease.
$0.99 – Purchase Checkout
Added to cart