Visualize Project Phases with Milestone Arrows
Product Description
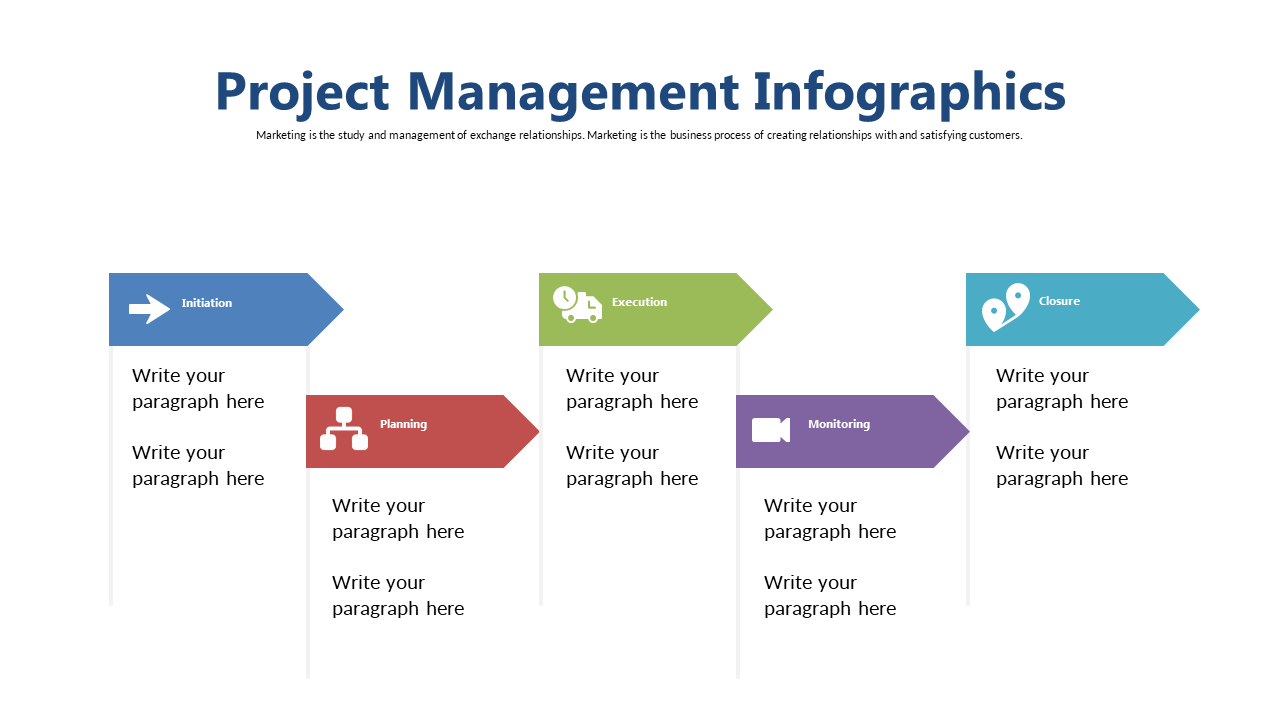
Keeping your team aligned can feel like a juggling act when managing multiple project phases. It often leads to confusion about where everyone stands in the process. This slide simplifies that by offering a visual representation of project phases with milestone arrows that guide your audience from initiation to closure effortlessly.
As a project manager or program director, you can use this in status update meetings, project kick-offs, or stakeholder briefings to clearly communicate the journey of your project. It’s also ideal for construction managers and IT project leads who need to illustrate the steps involved in their initiatives.
This clarity ensures everyone is on the same page. For just $0.99, you can download this slide instantly. It’s easy to customize in both PowerPoint and Google Slides, allowing you to make adjustments that suit your specific presentation needs within minutes.
$0.99 – Purchase Checkout
Added to cart