Showcase Project Stages with Colorful Infographic

Product Description
Communicating the various stages of a project can often leave your audience feeling lost in a sea of details. With numerous phases to cover, it’s easy to overwhelm people with information rather than guiding them through the essential steps.
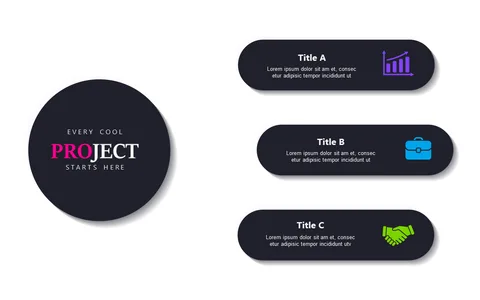
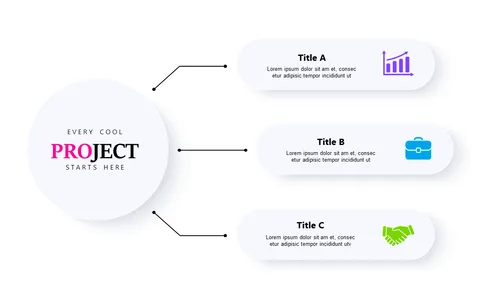
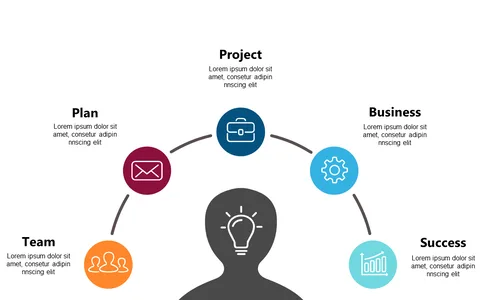
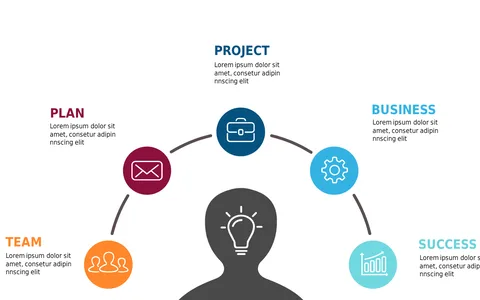
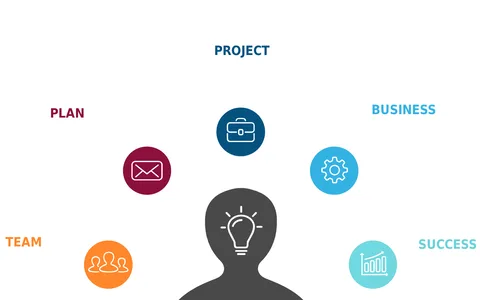
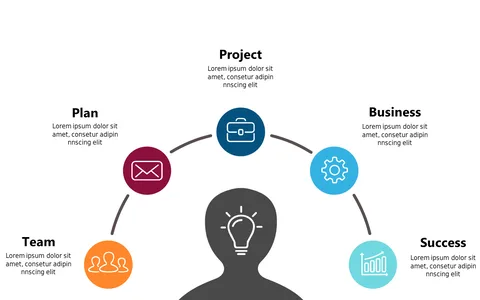
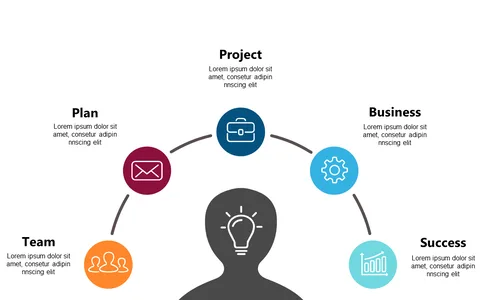
This colorful infographic provides a clear breakdown of each phase, allowing your audience to grasp the project’s flow at a glance. Project managers, team leads, and anyone involved in project execution will find this slide invaluable during stakeholder presentations or team meetings. Whether you’re discussing initiation, planning, or closure, this infographic makes it easy to walk your audience through complex information without losing their attention.
For just $0.99, you can instantly download this slide, which is fully editable in PowerPoint and Google Slides. Customize it to fit your specific project needs and have it ready in minutes.
$0.99 – Purchase Checkout
Added to cart