Visualize Project Management Phases with Infographic
Product Description
As a team lead, you know the importance of effectively communicating the phases of a project to keep your team aligned. Yet, translating project phases into easy-to-understand visuals can be challenging.
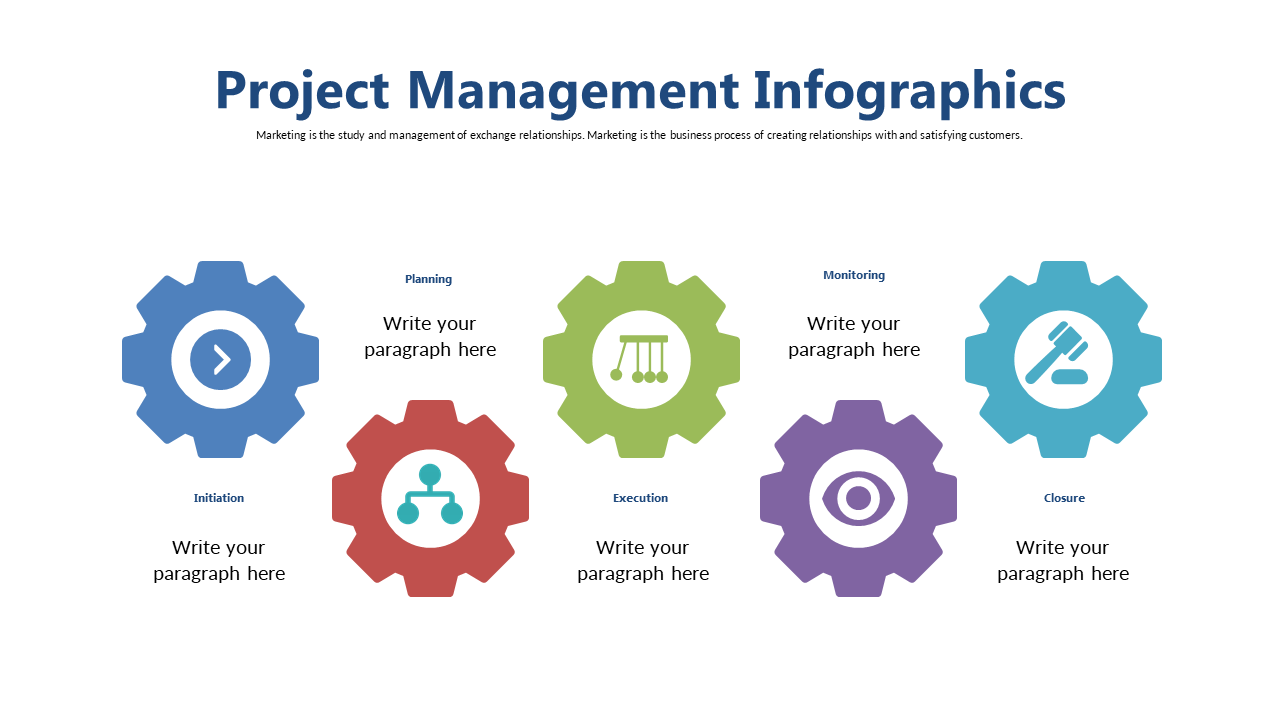
This colorful infographic simplifies that task with gear shapes and icons that represent project phases, making your message clear. Use this slide when leading project teams in fields like construction, healthcare, or marketing, particularly during project planning sessions, retrospectives, or client updates. It helps everyone visualize the workflow, reducing confusion and helping drive your project forward.
For only $0.99, this slide is ready to be downloaded instantly and is fully customizable in PowerPoint and Google Slides. You’ll be prepared to present a clear visual of your project phases in no time.
$0.99 – Purchase Checkout
Added to cart







