Show Seasonal Influence on Product Value Proposition
Product Description
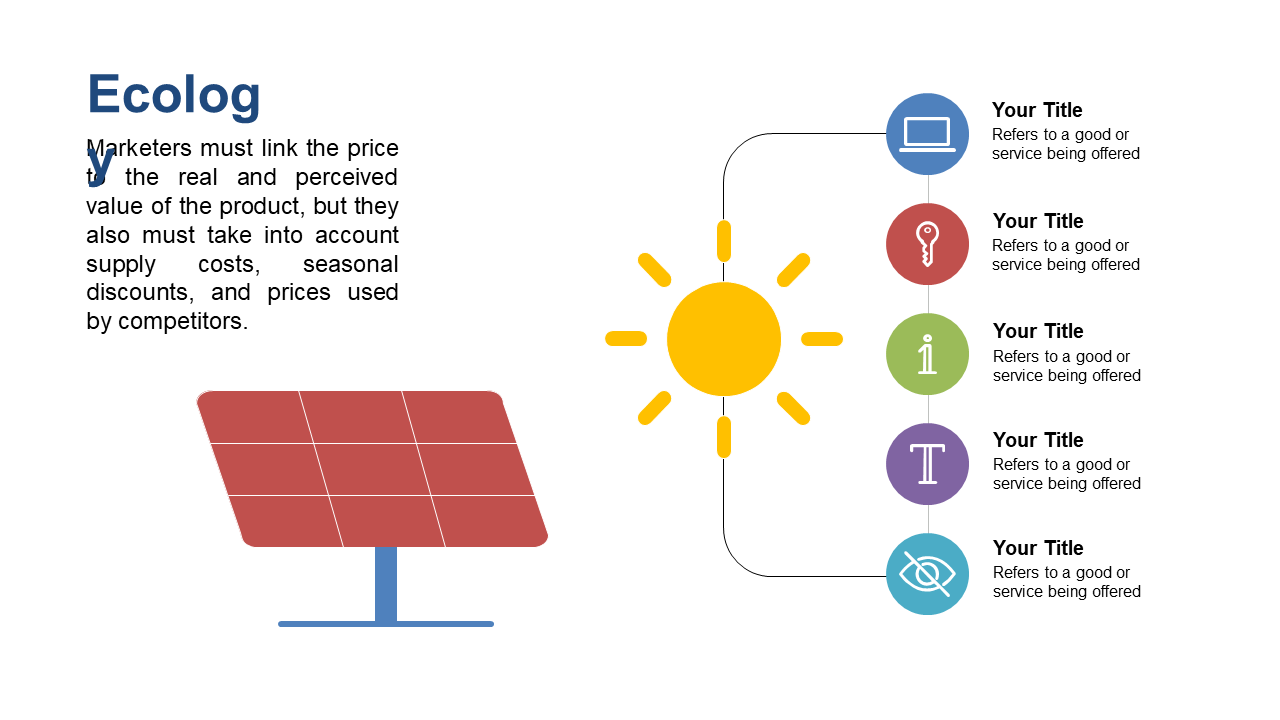
Demonstrating the impact of seasonality on your product’s value proposition can often feel overwhelming. This slide breaks down complex concepts into a clear visual format that highlights seasonal influences, making it easier for your audience to understand.
This is perfect for marketing directors and product managers preparing for client presentations or internal strategy discussions. Whether you’re discussing promotional tactics during holiday seasons or seasonal pricing adjustments, this slide will help you get your point across with clarity.
At just $0.99, this slide is readily available for instant download. You can edit it in PowerPoint or Google Slides, allowing you to customize it quickly for your specific presentation needs.
$0.99 – Purchase Checkout
Added to cart







