Product Comparison Layout with Laptop Image V2
Product Description
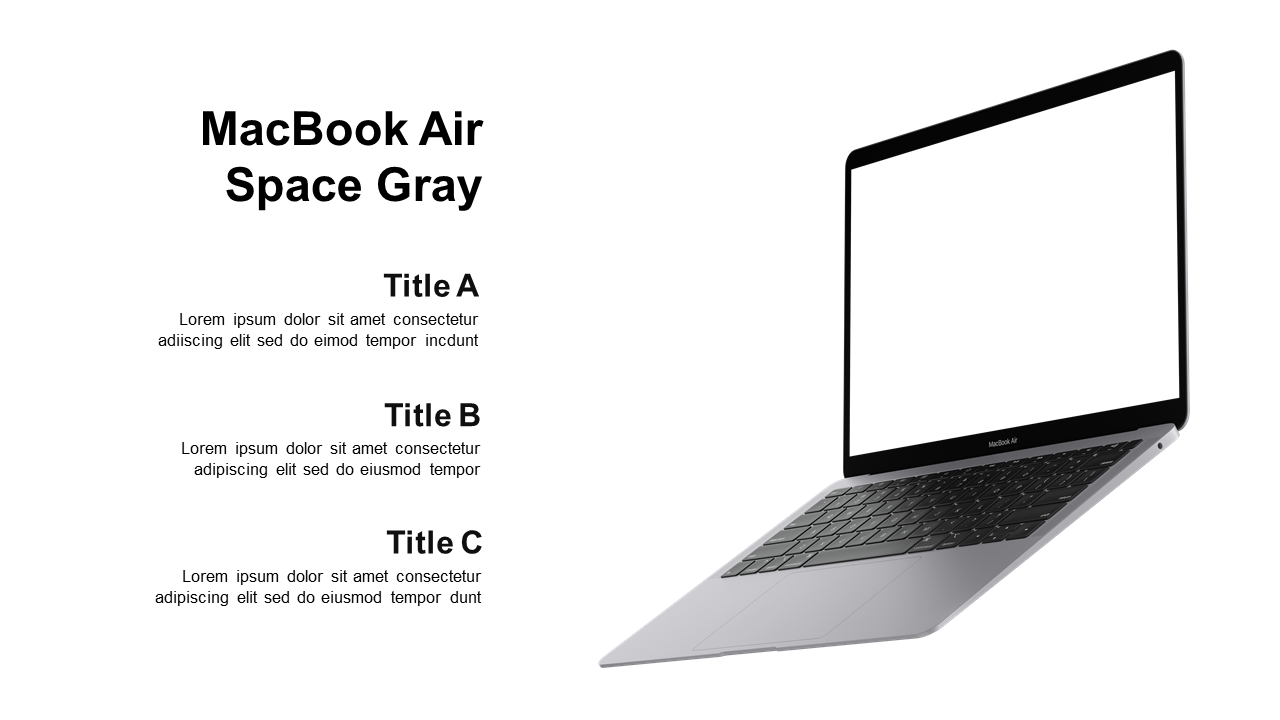
Crafting a compelling product comparison can feel overwhelming, especially when you want to capture your audience’s attention. This layout simplifies that process by combining a striking laptop image with clearly defined sections for usability and updates, ensuring your message hits home every time.
Marketers and product managers in the software industry can leverage this slide during sales presentations or webinars to convey essential features and updates clearly. It’s also suitable for competitive analysis meetings where you need to visually compare your product against others in the market.
Available for only $0.99, this slide is easy to download and modify in PowerPoint or Google Slides. With straightforward editable components, you can create a professional presentation in no time.
$0.99 – Purchase Checkout
Added to cart







