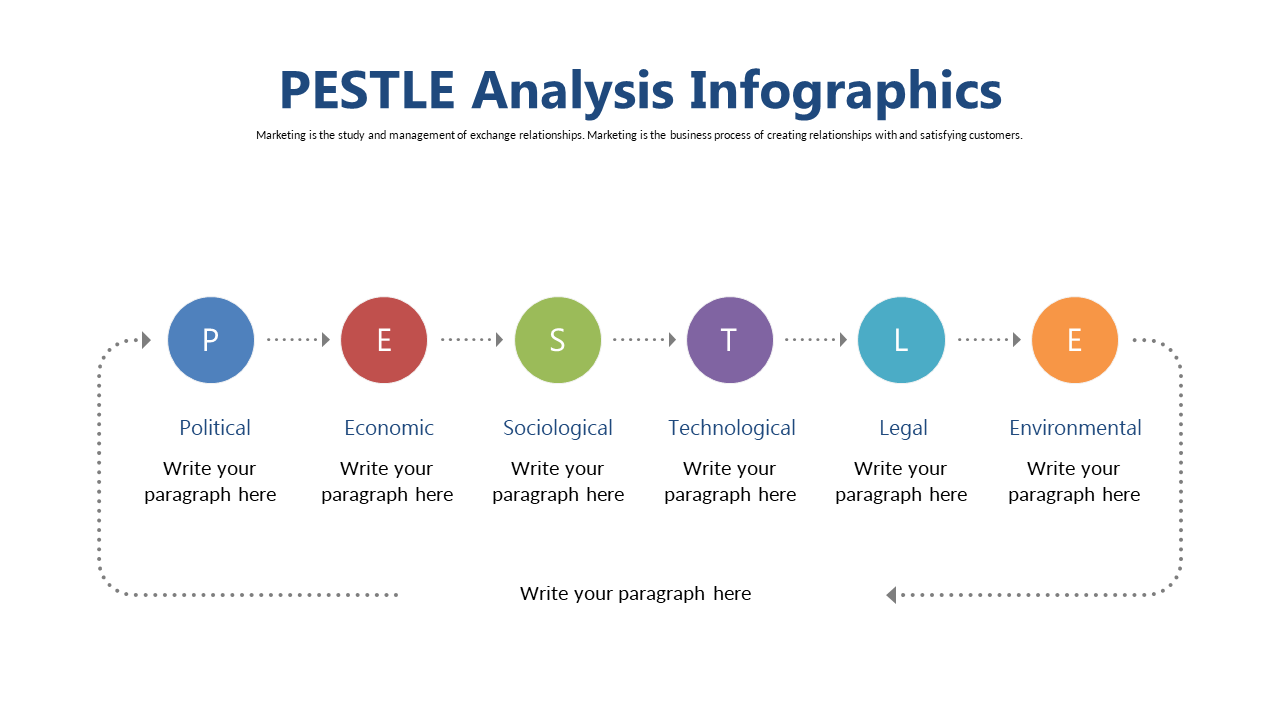
PESTLE Analysis with Colorful Circles and Arrows
Product Description
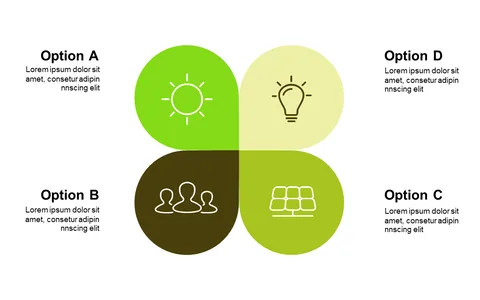
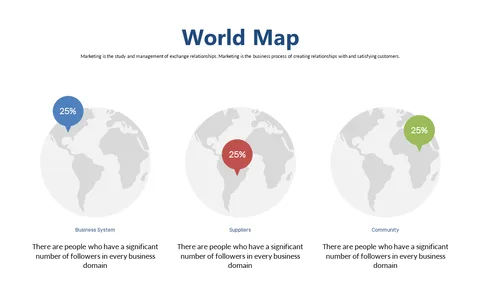
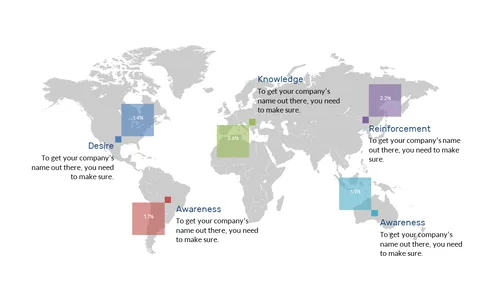
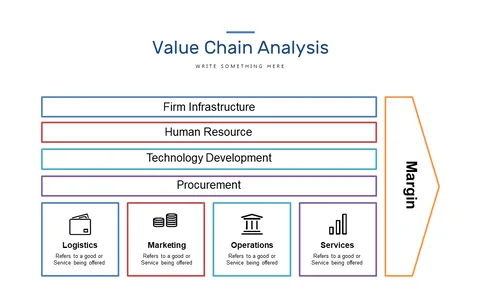
Capturing detailed market analysis in an engaging way is a common challenge for researchers. This slide creatively visualizes the PESTLE analysis with colorful circles and arrows, transforming dense information into a more lively and understandable format.
Perfect for market researchers or business development professionals, this slide is useful in scenarios like competitive analysis meetings or strategic planning sessions. It helps you present essential insights that can drive business decisions effectively.
At just $0.99, this slide is ready for instant download and can be easily edited in PowerPoint or Google Slides. You’ll have a polished presentation in no time!
$0.99 – Purchase Checkout
Added to cart
✅ Instant delivery
✅ Fully editable
✅ PowerPoint & Google Slides
Category:
$0.99
Per slide · No minimum · Pay only for what you pick
✓ $0.99/slide
No minimum order
✓ Mix any category
No subscription
Building a full deck?
Mix slides from any of our 58 categories —
all merged into one PowerPoint.
$0.99/slide, no minimum.
Browse All Slides →