Present Interconnected Ideas with Circular Bubbles
Product Description
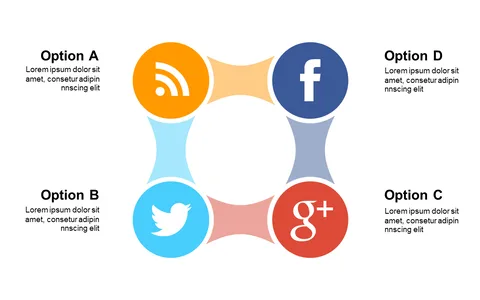
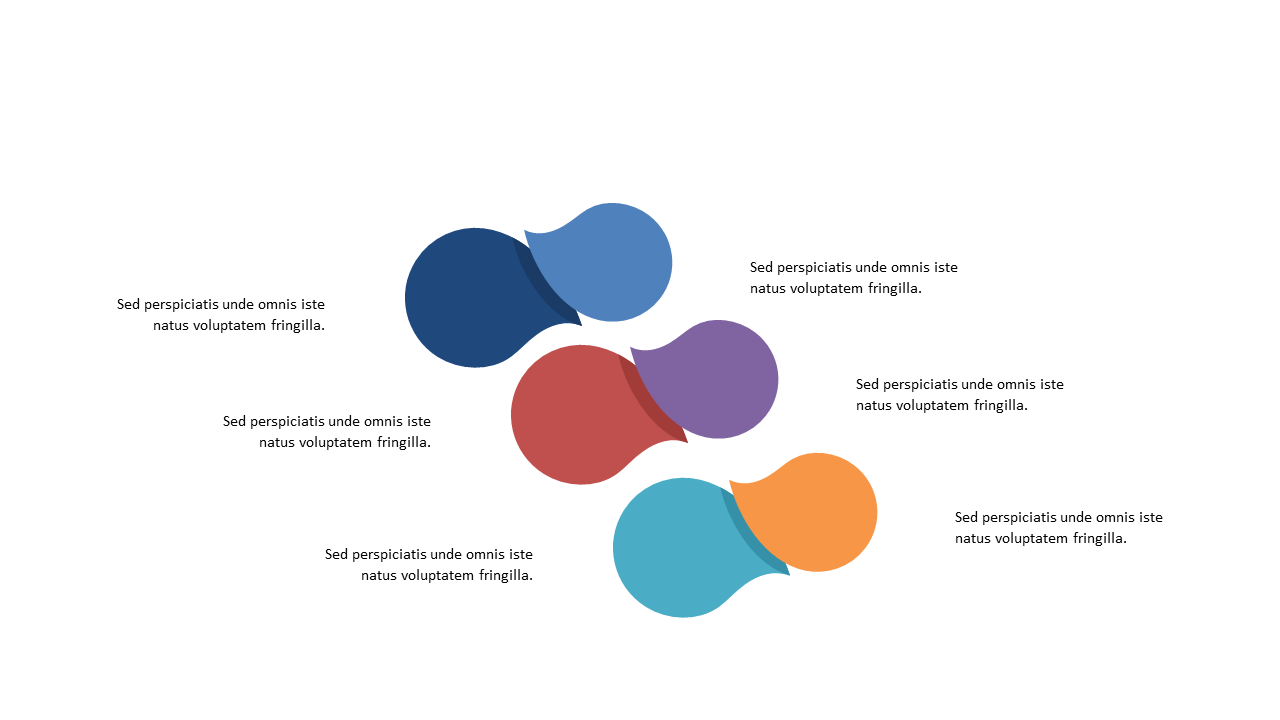
Trying to explain complex relationships in a meeting can be frustrating, especially when your audience struggles to grasp the connections between ideas. Relying on traditional linear diagrams often leads to confusion, preventing your message from hitting home. This circular bubble diagram is designed to visually illustrate interconnected ideas, making your points clearer and more engaging.
Consultants, team leads, and educators often find themselves needing to simplify complex concepts during presentations. Whether you’re conducting a workshop, leading a strategy meeting, or facilitating a training session, this slide helps you convey your thoughts without losing your audience. It’s perfect for showing how multiple factors relate to a central theme or concept.
For just $0.99, you can instantly download this slide and make it your own. It’s fully editable in PowerPoint and Google Slides, allowing you to tailor the content and colors to match your presentation style. Get started in minutes and transform your ideas into a visually appealing format.
$0.99 – Purchase Checkout
Added to cart