Convey Sequential Steps with Numbered Icons
Product Description
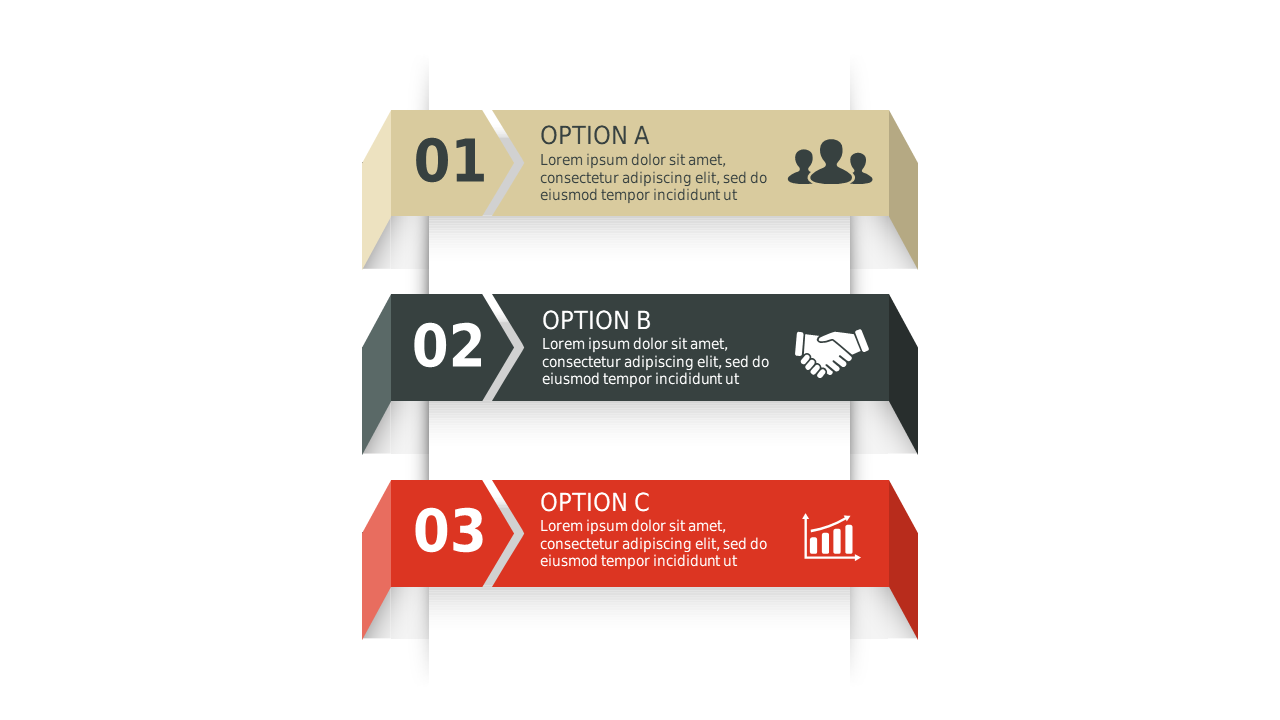
Complex processes can often be a hurdle when trying to engage your audience, especially if clarity is lacking. Many find it difficult to present sequential steps that resonate well, leading to confusion and miscommunication. This slide provides a straightforward layout with distinct numbered steps, ensuring that your audience can easily follow along with each key point.
You might find this slide particularly useful if you’re a team leader discussing project milestones or a business analyst explaining a process improvement initiative. It’s also valuable for consultants presenting recommendations to clients, where step-by-step clarity is essential.
No matter your context, this slide helps to convey clarity in your message. Available for only $0.99, this slide can be downloaded right away. It’s fully editable in PowerPoint and Google Slides, making customization quick and easy to fit your presentation style.
$0.99 – Purchase Checkout
Added to cart







