Showcase Marketing Insights with Funnel Infographic

Product Description
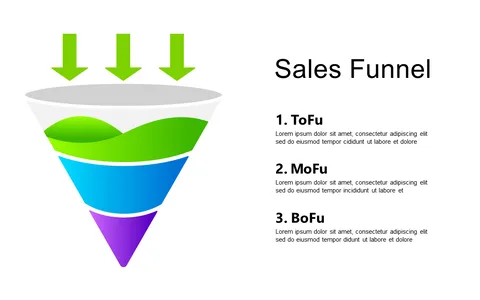
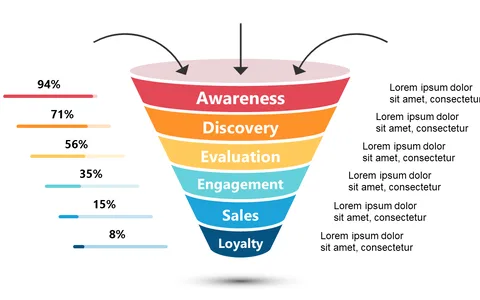
Understanding customer behavior is crucial for driving sales, yet many struggle to present this information effectively. This slide features an infographic that breaks down the marketing funnel into three distinct stages: Awareness, Consideration, and Conversion, ensuring your insights are presented in a visually compelling manner.
It’s designed to make complex information digestible for your audience. Brand strategists, sales directors, or digital marketers can use this slide in various settings, whether it’s an annual strategy meeting or a quarterly performance review. It’s also beneficial for business development teams aiming to align marketing efforts with sales objectives or for startups seeking to showcase their customer acquisition strategy to potential investors.
For only $0.99, you can instantly download this slide and customize it to suit your presentation style. It’s easy to edit in PowerPoint and Google Slides, allowing you to have a professional-quality visual ready in no time.
$0.99 – Purchase Checkout
Added to cart