Highlight Engagement Metrics in Marketing Funnels

Product Description
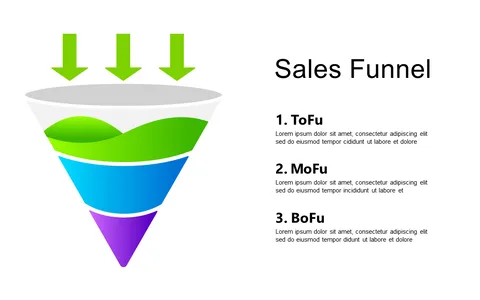
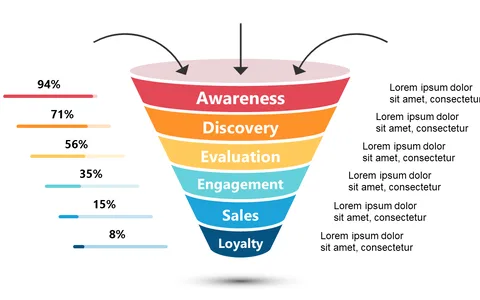
Illustrating the stages of a marketing funnel can be tough, especially when you need to convey specific engagement metrics that matter most. You want your audience to grasp how prospects move from awareness to consideration and finally to the decision stage without drowning them in complex data.
This slide helps you break it down effectively, showcasing key metrics in an easily digestible format. Whether you’re a marketing manager presenting quarterly results, a sales director reviewing pipeline performance, or a digital marketer showcasing campaign effectiveness, this layout is tailored for you. Each section of the funnel is designed to highlight conversion rates, making it perfect for meetings where you need to convince your team of the value of your marketing strategies.
For just $0.99, you can download this slide in minutes and customize it to fit your specific data points. It’s ready for use in both PowerPoint and Google Slides, ensuring a quick edit for any presentation you have in mind.
$0.99 – Purchase Checkout
Added to cart