Visualize Engagement Metrics in Marketing Funnels

Product Description
Clearly visualizing engagement metrics can be tricky when your audience needs to grasp complex data quickly. Generic slides often fail to provide clarity and can lose the audience’s attention.
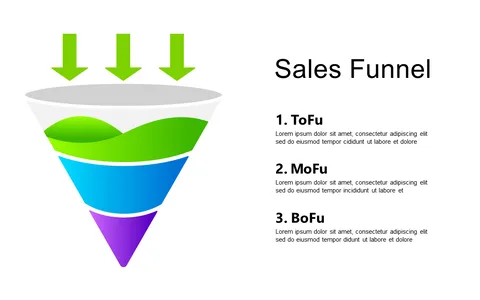
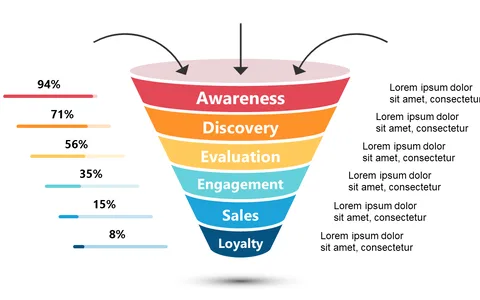
This marketing funnel layout breaks down key metrics into three distinct sections, ensuring that your message about conversions and customer engagement is both clear and engaging. Marketing professionals, sales directors, and project leads can employ this slide during quarterly meetings or strategy briefings, making it an essential tool when discussing the effectiveness of marketing campaigns. You can easily illustrate where customers drop off in their journey and where improvements are needed, leading to a more impactful discussion about future strategies.
At just $0.99, this slide is available for instant download and can be edited in PowerPoint or Google Slides without hassle. Customizing the data and visuals to reflect your specific needs is straightforward, allowing you to have a polished presentation ready in no time.
$0.99 – Purchase Checkout
Added to cart