Highlight Customer Engagement with Funnel Diagrams

Product Description
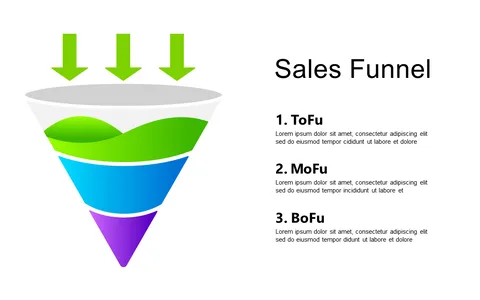
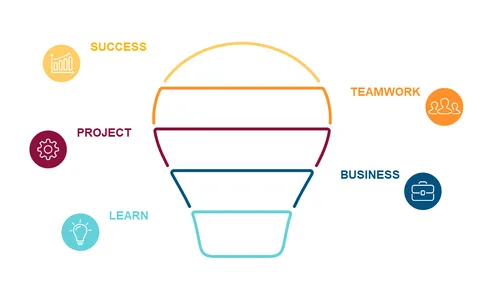
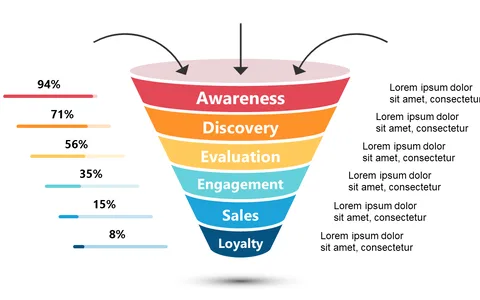
Understanding how customers move through their engagement journey can feel overwhelming, especially when you need to present this information clearly. A generic diagram won’t cut it; you want something that captures attention and communicates your message effectively. This funnel diagram simplifies the stages of customer engagement, helping you illustrate the path from awareness to loyalty without losing your audience.
Marketing managers, sales leaders, and customer experience professionals will find this slide particularly useful for presentations at quarterly reviews or strategy meetings. You can use it to explain how your current retention strategies are performing or to propose new initiatives based on customer behavior insights.
Showing the funnel visually helps your team grasp complex concepts around customer interactions and conversions. For just $0.99, this slide is an instant download that you can easily edit in PowerPoint or Google Slides. Customizing colors, labels, and text styles to match your brand is a breeze, allowing you to tailor it to any presentation in just minutes.
$0.99 – Purchase Checkout
Added to cart