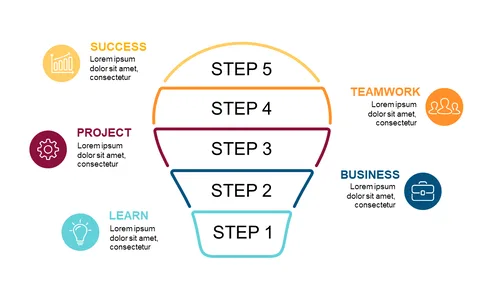
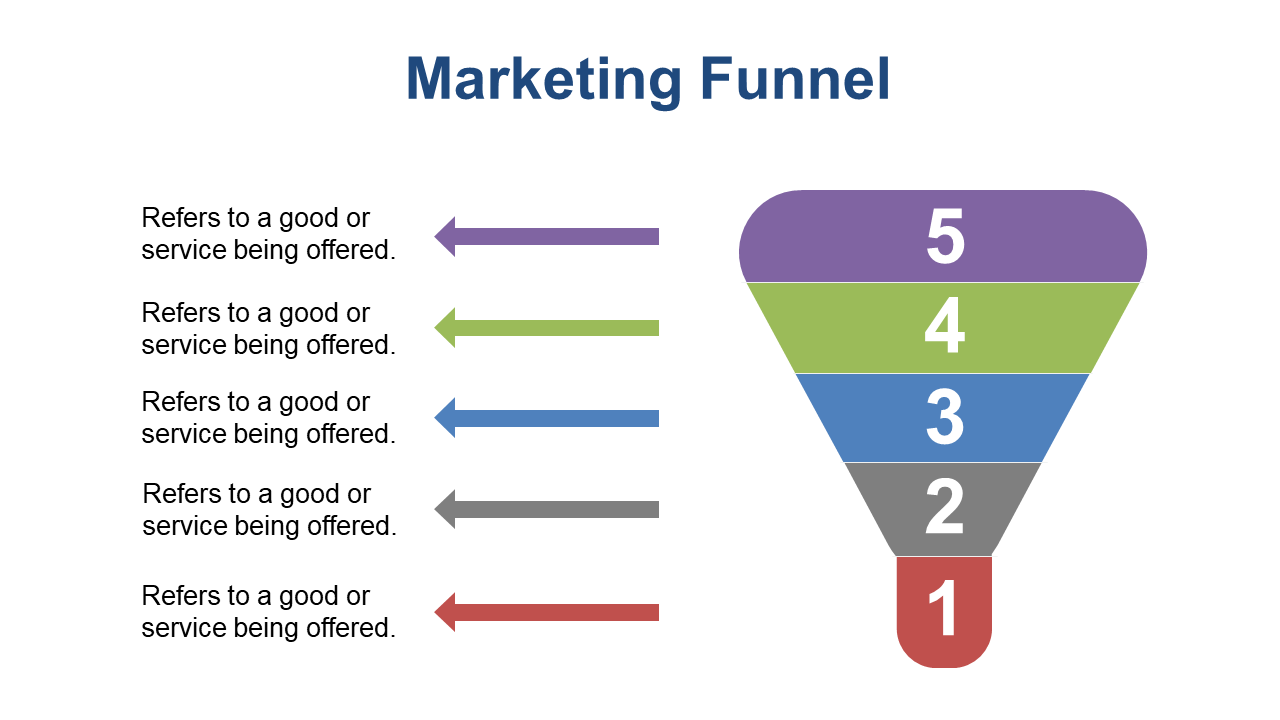
Visualize Sales Process with 5-Step Funnel Diagram
Product Description
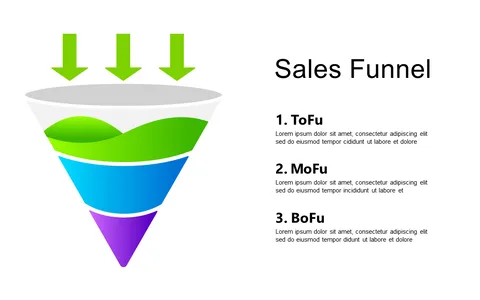
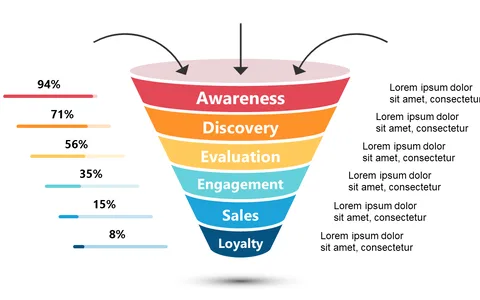
Struggling to present a complex sales process clearly? This 5-step funnel diagram simplifies your narrative, allowing you to showcase each stage of the sales cycle while keeping your audience engaged.
Sales executives and business development professionals can use this slide during pitch meetings, operational reviews, or training sessions. It’s perfect for illustrating the customer’s journey in sectors like retail, SaaS, or B2B services where understanding the sales process is crucial.
At just $0.99, you can download this slide and edit it easily in PowerPoint or Google Slides. Get started right away and ensure your sales process is crystal clear for your audience.
$0.99 – Purchase Checkout
Added to cart
✅ Instant delivery
✅ Fully editable
✅ PowerPoint & Google Slides
Category:
$0.99
Per slide · No minimum · Pay only for what you pick
✓ $0.99/slide
No minimum order
✓ Mix any category
No subscription
Building a full deck?
Mix slides from any of our 58 categories —
all merged into one PowerPoint.
$0.99/slide, no minimum.
Browse All Slides →