Analyze Marketing Trends with Word Clouds
Product Description
Sorting through piles of data to analyze market trends can feel overwhelming and time-consuming. It’s crucial to present your findings in a digestible way, but traditional charts can often fall flat.
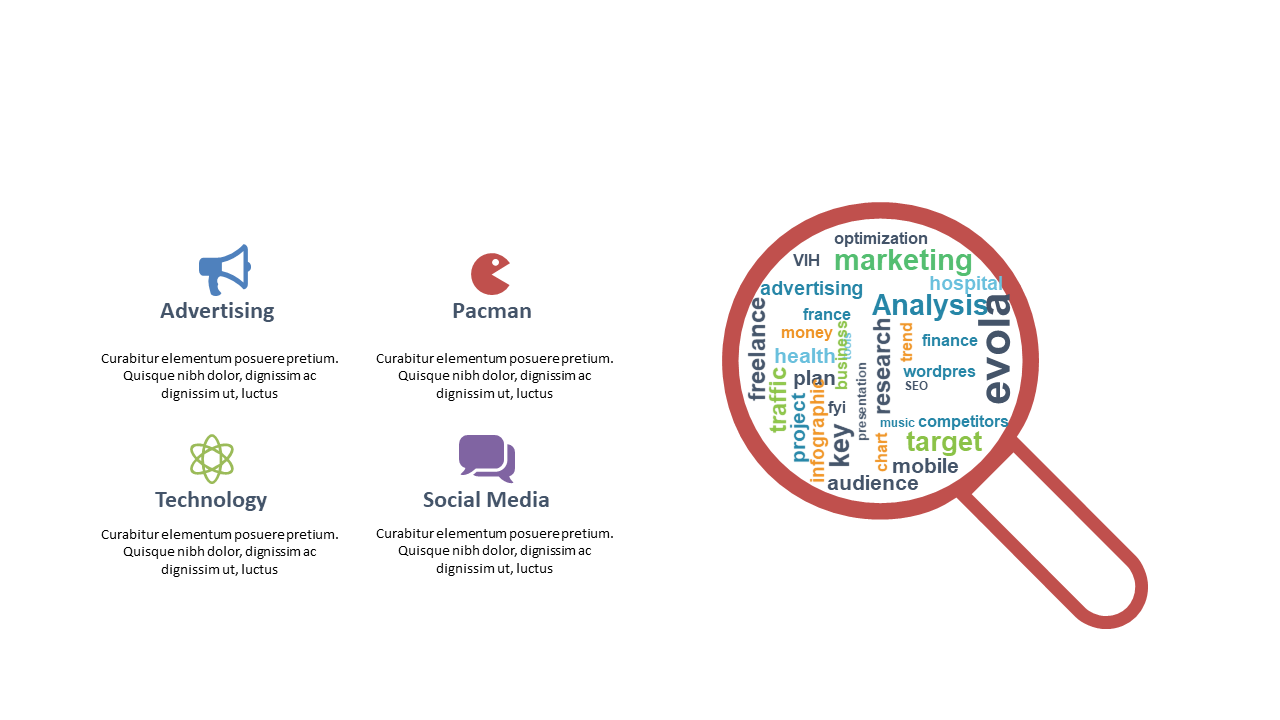
This slide simplifies your analysis with an eye-catching word cloud that highlights essential marketing terms, all under the scrutiny of a magnifying glass. Whether you’re a market researcher, business analyst, or a product manager preparing for quarterly reviews, this slide is tailored to help you convey insights clearly. It’s ideal for presentations where you need to summarize findings for marketing teams, executive briefings, or client reports without drowning them in numbers.
At just $0.99, this slide is ready for instant download and easy to edit in PowerPoint or Google Slides. You can quickly customize it to fit your needs and have a polished presentation ready in no time.
$0.99 – Purchase Checkout
Added to cart