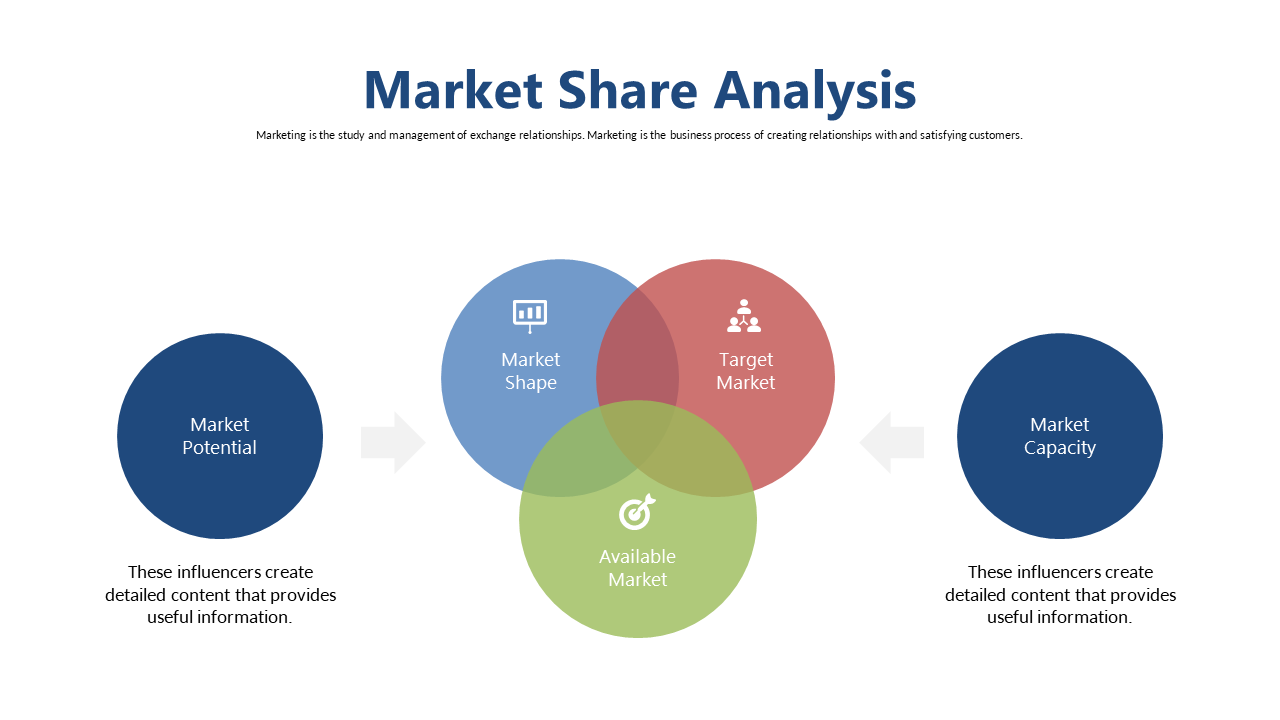
Navigating the complexities of market dynamics can be challenging, especially when trying to convey intricate relationships between different market factors. This slide presents a visually engaging Venn diagram that merges a circular flow design, making it easy to illustrate key concepts such as Market Potential, Target Market, and Market Capacity. The design allows for clear delineation of overlapping areas, which can be essential for understanding how different segments relate to one another. For a marketing manager, this slide can effectively communicate market share analysis during team meetings or client presentations, ensuring that everyone grasps the essential connections. A strategy consultant can utilize this slide to showcase the interplay of various market forces, helping clients understand strategic positioning. Meanwhile, a market researcher might find this slide invaluable for presenting findings in a way that highlights potential market opportunities. The slide is fully customizable, allowing you to adjust shapes, colors, and text to suit your specific needs. $0.99 — add this single slide to any deck from the SlideSwift Slide Library. No subscription needed. Mix slides from any category to build your perfect deck.
 SlideSwift