Engage Audiences with Layered Diamond Process V4
Product Description
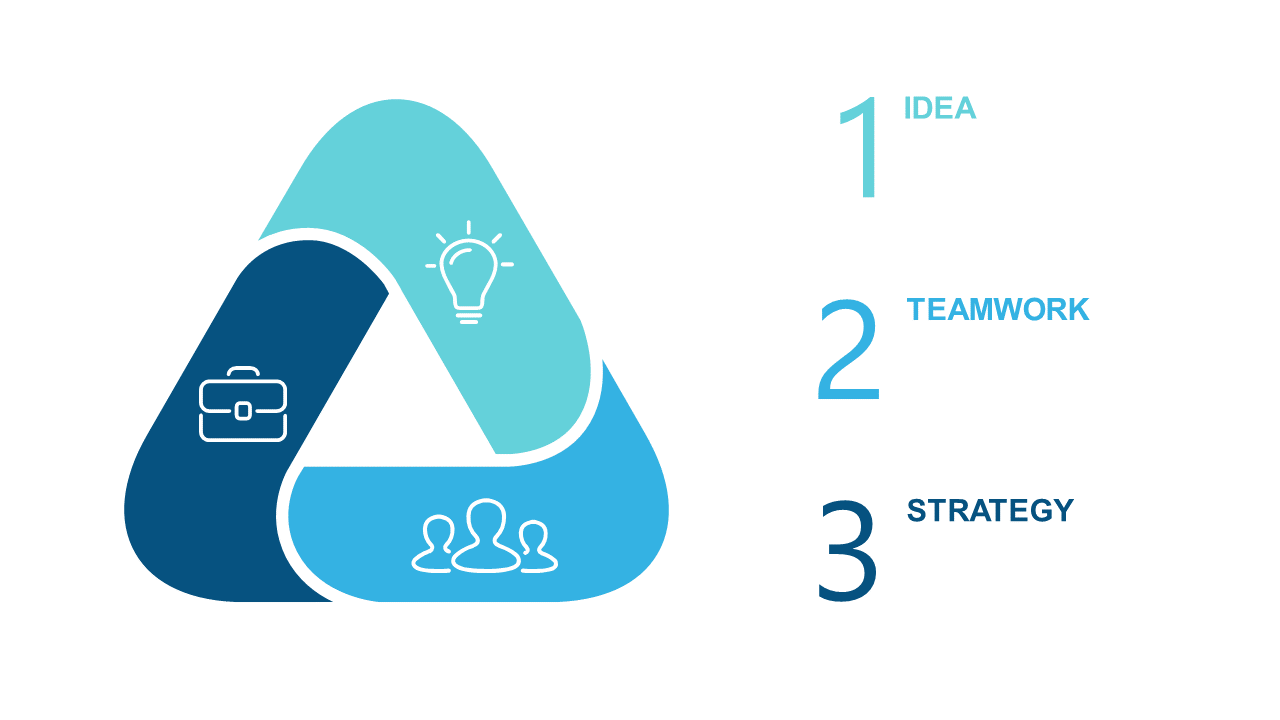
Explaining intricate workflows can be daunting, and without clear visuals, your audience might miss crucial details. This layered diamond process slide simplifies the presentation of complex information, breaking it down into digestible parts with intuitive icons that enhance understanding.
It allows you to convey your message clearly and effectively. Business analysts, product managers, and consultants will appreciate this slide during project kick-off meetings or status updates. It’s perfect for visualizing analytical processes or mapping out customer journeys, helping you ensure everyone is on the same page.
At just $0.99, this slide is an easy addition to your presentation toolkit. Available for instant download, it’s fully editable in PowerPoint and Google Slides, so you can make quick adjustments based on your audience’s needs.
$0.99 – Purchase Checkout
Added to cart







