Highlight Information Levels with Circular Diagram
Product Description
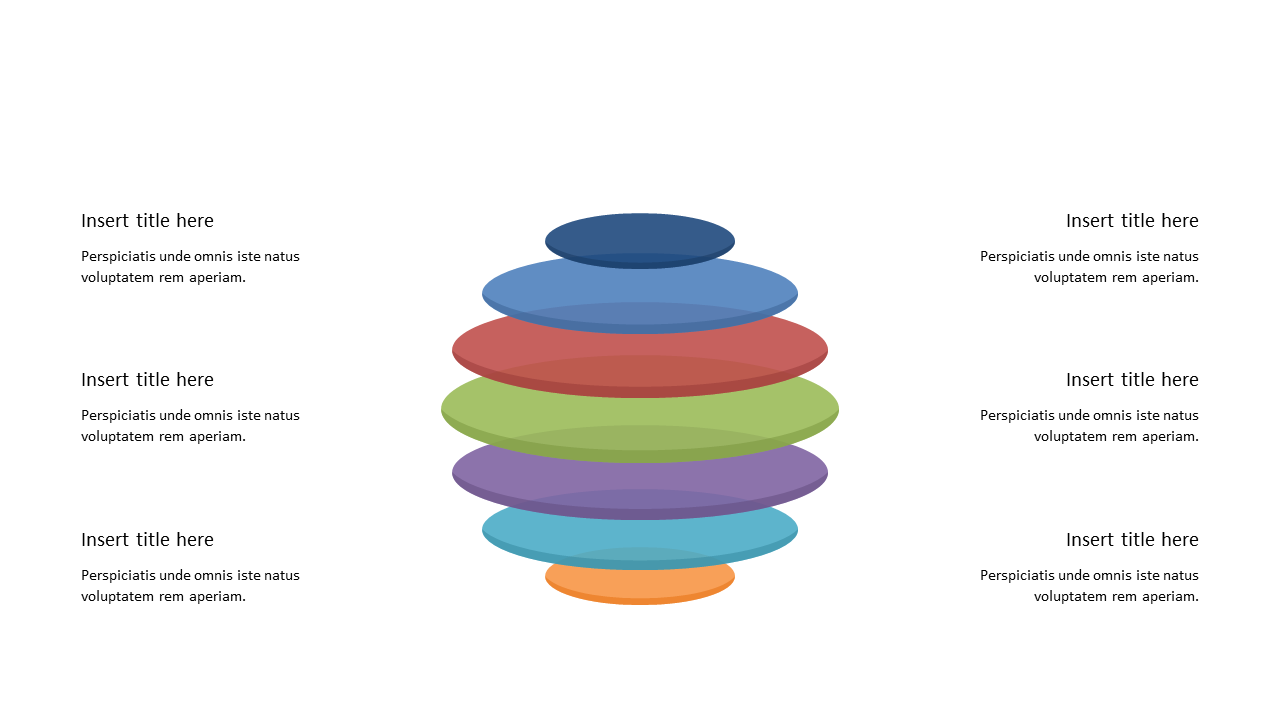
Communicating complex information is often a challenge, particularly if clarity is essential for your audience. This circular diagram provides a structured and visually appealing way to highlight different levels of information or processes, ensuring your message is conveyed effectively.
Consider using this slide in scenarios like compliance officers outlining regulatory levels, financial analysts breaking down budget categories, or educators explaining curriculum tiers. It keeps your audience engaged while clearly presenting critical information, making it easier for them to follow along.
For just $0.99, you can download this slide instantly and edit it with ease in both PowerPoint and Google Slides. Customize it quickly to meet your needs and enhance your presentation in just minutes.
$0.99 – Purchase Checkout
Added to cart







