Visualize Data Points with Branching Flow Layout
Product Description
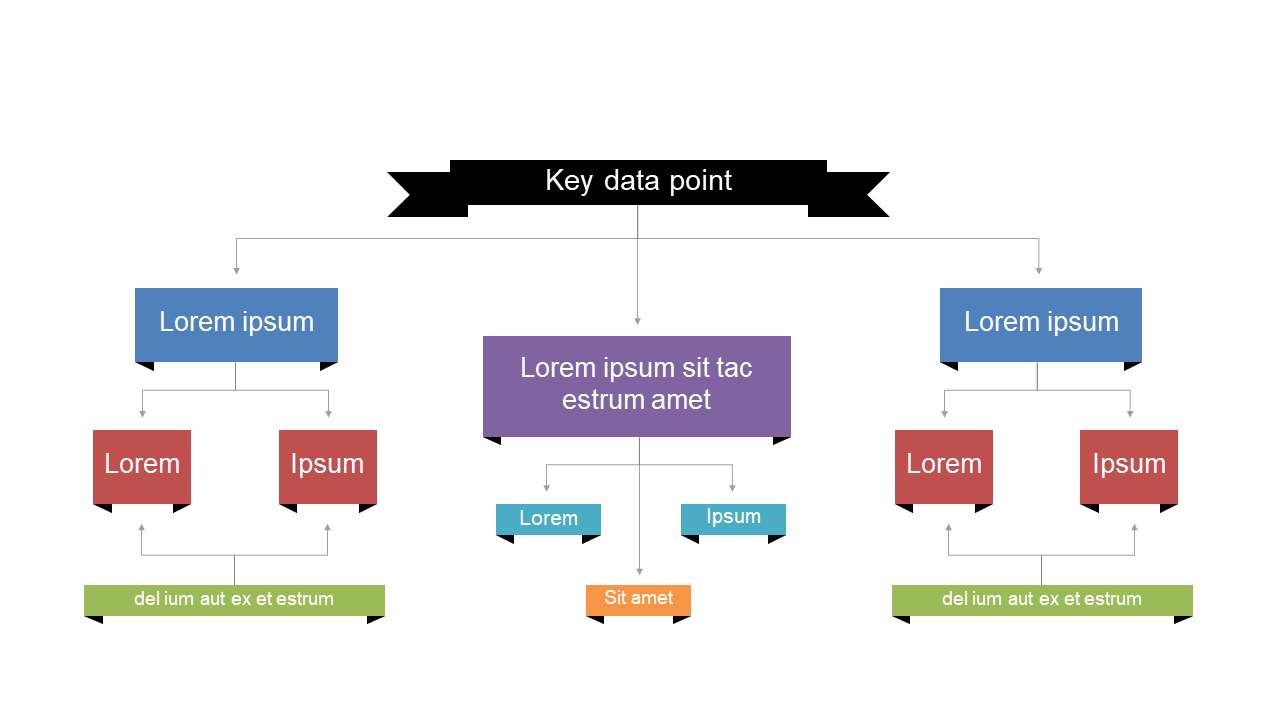
Presenting intricate data relationships can often feel overwhelming, especially when the audience struggles to connect the dots. This branching flow layout simplifies that task by clearly outlining how different data points interconnect, making your presentation easier to follow and more impactful. You can finally showcase your findings in a way that’s visually appealing and straightforward.
Data analysts, project managers, and research teams in sectors like technology or finance will find this slide particularly useful. Imagine delivering a report on user engagement metrics or presenting a project timeline where clarity is crucial.
This layout allows you to emphasize the relationships between data points effectively, ensuring that your audience stays engaged and grasp the main ideas effortlessly. For just $0.99, you can download this slide, which is fully editable in PowerPoint and Google Slides. You’ll have it ready in minutes, allowing you to focus on perfecting your message rather than spending hours on design.
$0.99 – Purchase Checkout
Added to cart







