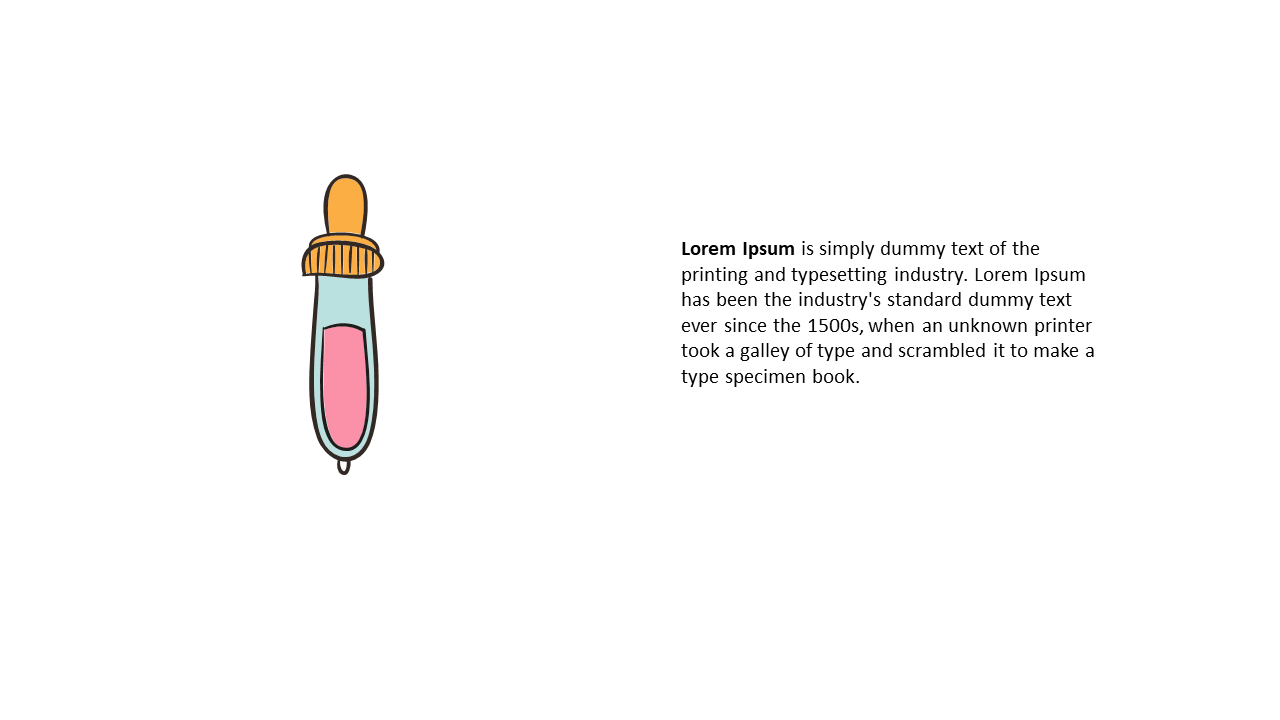
Present Information with Illustrated Dropper Graphic
Product Description
Explaining complex information doesn’t have to overwhelm your audience. This illustrated dropper graphic slide helps simplify your message and keeps your audience engaged through visual storytelling.
By using a creative graphic, you can turn intricate data into something more digestible and captivating. This slide works perfectly for data analysts presenting insights, marketers introducing new strategies, or educators explaining scientific concepts. Whether you’re delivering quarterly reports or launching a new product, this visual aid enhances understanding and maintains attention when it matters most.
You can download this slide for only $0.99, and it’s ready for immediate editing in PowerPoint and Google Slides. Get started on making your presentation clear and engaging in just a few minutes.
$0.99 – Purchase Checkout
Added to cart