Enhance Presentations with Business Icons

Product Description
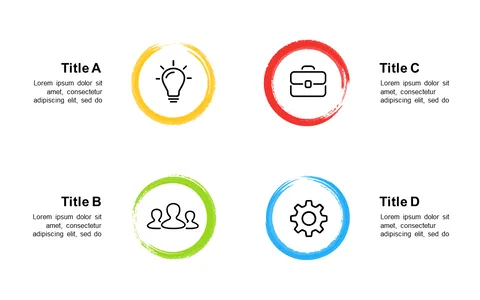
Enhancing your presentations shouldn’t feel like a chore, especially when you’re trying to convey critical business metrics. This slide provides a polished icon set, making it simple to visually represent important concepts in your presentations.
It’s designed for busy professionals who want to keep their audience engaged without overwhelming them. Consider a business strategist showcasing market analysis or a financial analyst detailing budget forecasts. This layout is ideal for roles in finance, project management, or business development where clarity and visual appeal can drive home your points during meetings or reports.
At just $0.99, this slide is a quick download that’s ready for you to personalize in minutes. Edit in PowerPoint or Google Slides, and elevate your presentation game effortlessly.
$0.99 – Purchase Checkout
Added to cart