Visually Convey Business Metrics with Icons

Product Description
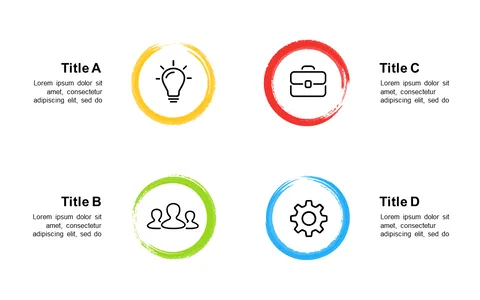
When it comes to conveying business metrics, visual clarity is key. This layout features a collection of icons designed to represent various concepts in a way that’s both engaging and straightforward.
If you often find that numbers and data overwhelm rather than inform, this slide is your solution. Imagine a sales manager presenting performance metrics or a project lead sharing data insights during a team meeting. This slide is perfect for roles in sales, finance, or analytics, where visualizing key ideas can enhance understanding and retention during discussions and presentations.
For just $0.99, you can download this slide instantly and start editing it in PowerPoint or Google Slides. It’s a simple way to customize your visuals to match your style and needs, ready to impress your audience in no time.
$0.99 – Purchase Checkout
Added to cart