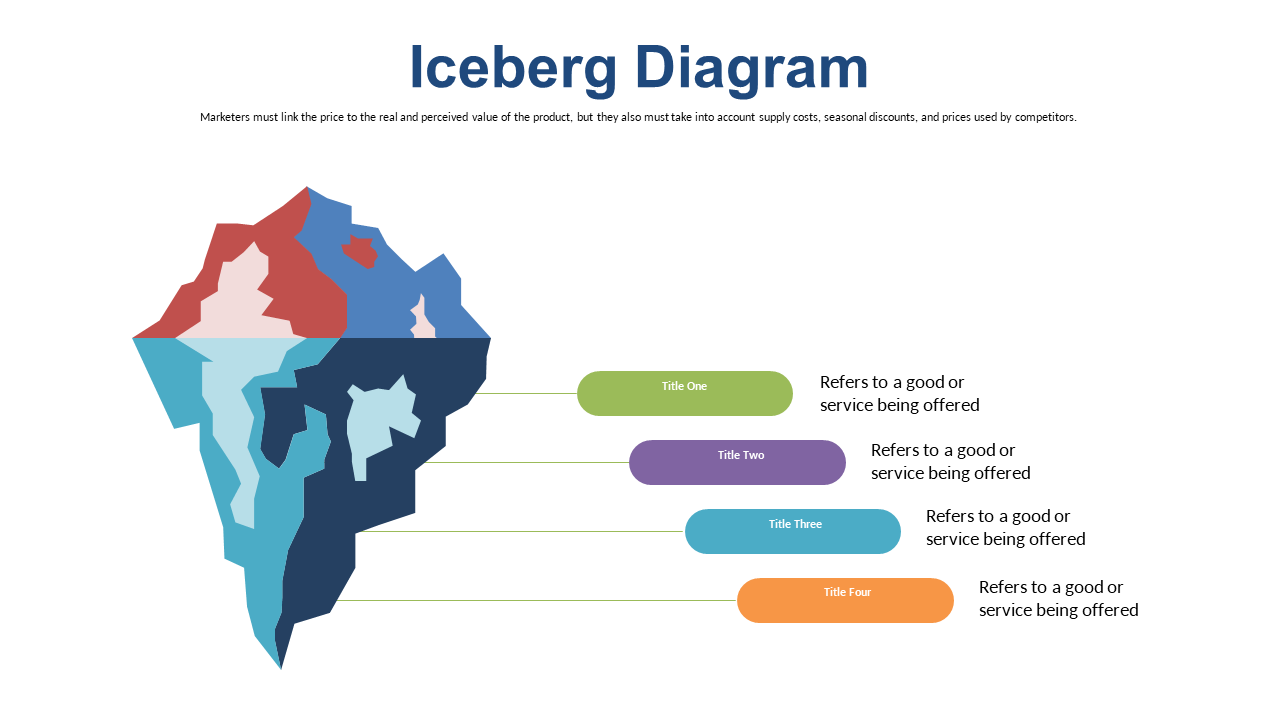
Highlight Value Factors with Iceberg Diagram
Product Description
In any project, conveying the right information about value can significantly impact outcomes. Architects often find it challenging to illustrate the elements that contribute to perceived value, especially when some factors are hidden beneath the surface.
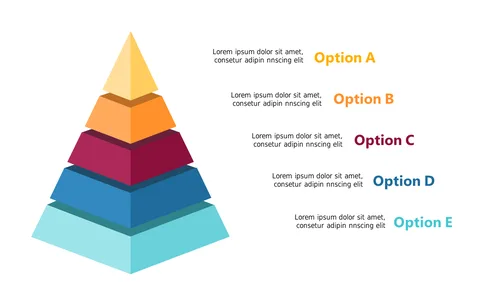
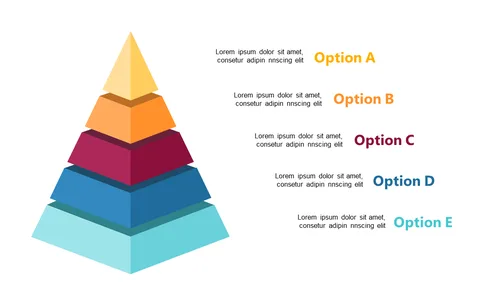
This Iceberg Diagram clarifies those complexities, allowing you to present information in an accessible way. This slide is particularly useful for project managers, architects, or design consultants who need to communicate project value during client meetings, design reviews, or presentation pitches. It helps your audience understand the various factors that contribute to overall value without feeling overwhelmed.
At just $0.99, you can quickly download this slide and customize it in PowerPoint or Google Slides. It’s an easy way to enhance your presentations and ensure you communicate your ideas effectively in a short amount of time.
$0.99 – Purchase Checkout
Added to cart