Explore Price Perception with Iceberg Diagram
Product Description
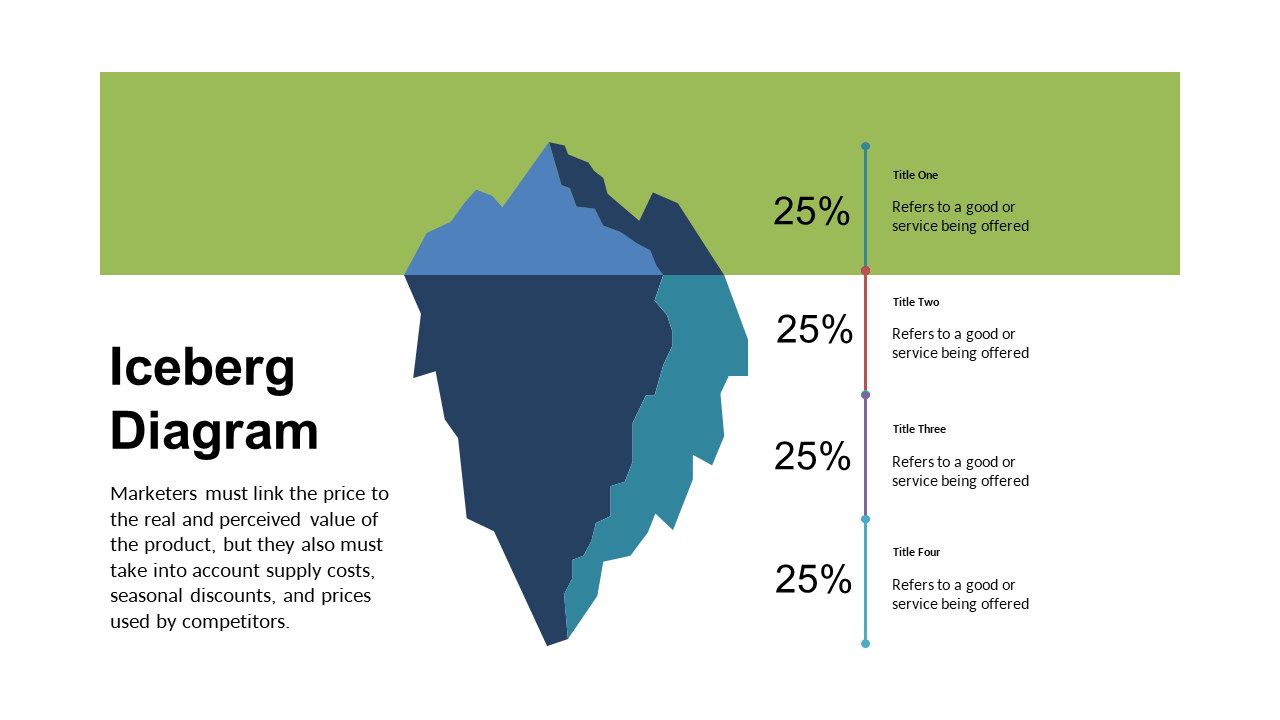
Understanding price perception can be a complex endeavor, especially when trying to clarify how various factors shape consumer views. This Iceberg Diagram effectively highlights the underlying influences on pricing strategies, making it easier to convey the nuanced aspects of value.
This slide is perfect for market researchers analyzing pricing models, sales professionals explaining their pricing rationale, or managers guiding teams through strategy development. It’s great for meetings where you need to unpack the complexities of pricing to achieve a clear understanding among participants.
For only $0.99, this slide is an instant download and can be easily edited in both PowerPoint and Google Slides. You’ll be ready to customize it to fit your needs and engage your audience effectively in no time.
$0.99 – Purchase Checkout
Added to cart







