Show Price vs Value with Iceberg Diagram
Product Description
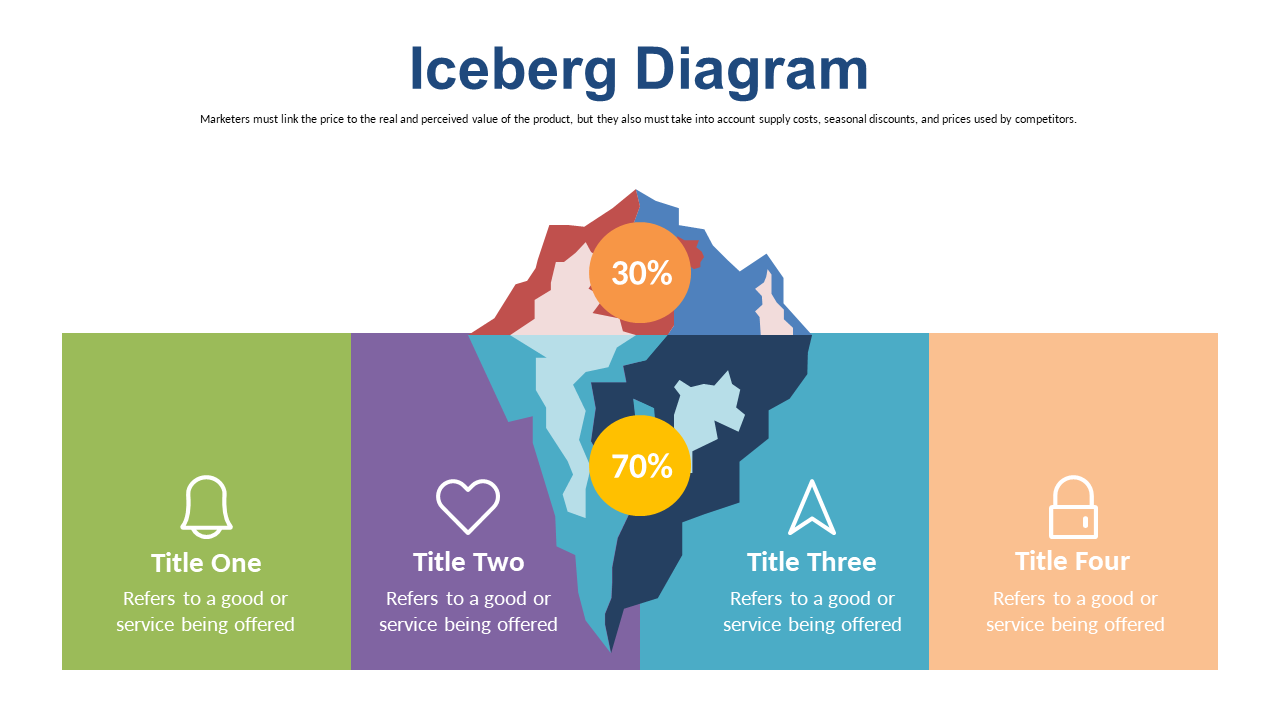
Clients often fixate on the initial price without recognizing the broader value your offerings deliver. The Iceberg Diagram clearly depicts the distinction between perceived value and actual price, making it easier for you to communicate the deeper benefits of your products or services.
Sales professionals and account managers in industries like real estate or consulting will find this tool especially useful during client meetings or negotiations. This slide helps you delve into discussions about long-term benefits versus upfront costs, effectively guiding your clients to a better understanding.
For just $0.99, this slide is available for instant download and is easy to edit in PowerPoint and Google Slides. You can quickly adapt it to your specific context, making it a breeze to use in your presentations.
$0.99 – Purchase Checkout
Added to cart







