Visualize Price Perception with Iceberg Diagram
Product Description
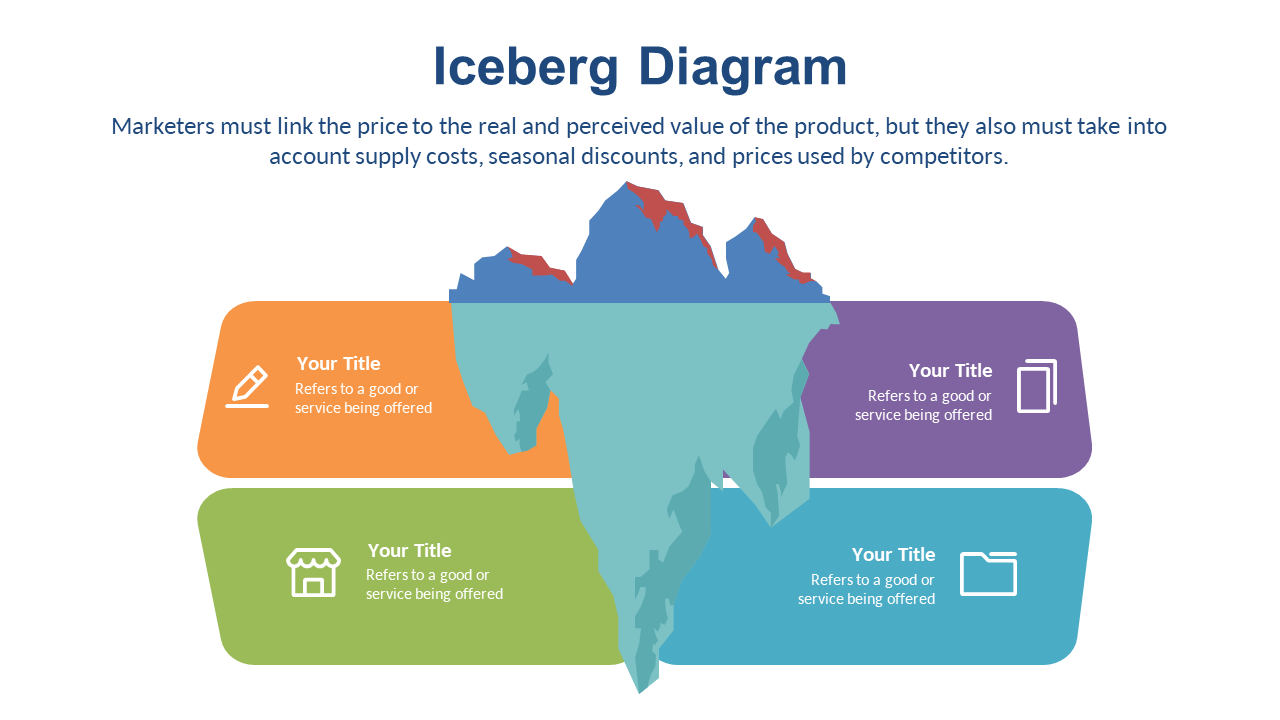
Decoding price perception can be a significant obstacle in a competitive market. The Iceberg Diagram offers a clear visual representation that showcases the myriad factors affecting customer decisions, from supply costs to competitor pricing, helping you convey your message with precision.
This slide is ideal for marketing professionals, product managers, and sales teams when preparing for product launch presentations or marketing strategy sessions. It gives everyone a shared understanding of how price perception is shaped, allowing for more informed decision-making across departments.
At only $0.99, this slide is ready for instant download and can be easily customized in both PowerPoint and Google Slides. Enhance your materials in no time to effectively communicate your pricing strategy.
$0.99 – Purchase Checkout
Added to cart







