SlideSwift
By Category
💼Business 📊Infographics □Minimal 🕐Timelines ✨Neumorphic 🗑Diagrams 🔄Flow Charts ✨Glassmorphism 🎨Creative 🌍Abstract 🔄Cycle Diagrams 💎Isometric 🖼Illustrations 📱Social Media 🗺MapsBy Slide Type
🚀Pitch Deck 📌Roadmap 🔍SWOT Analysis 📅Timeline 📈Gantt Chart 🏢Org Chart 📋Funnel ⚖Comparison 📄Case Study 📋Agenda ⭐Icons & Lists 👏Thank You
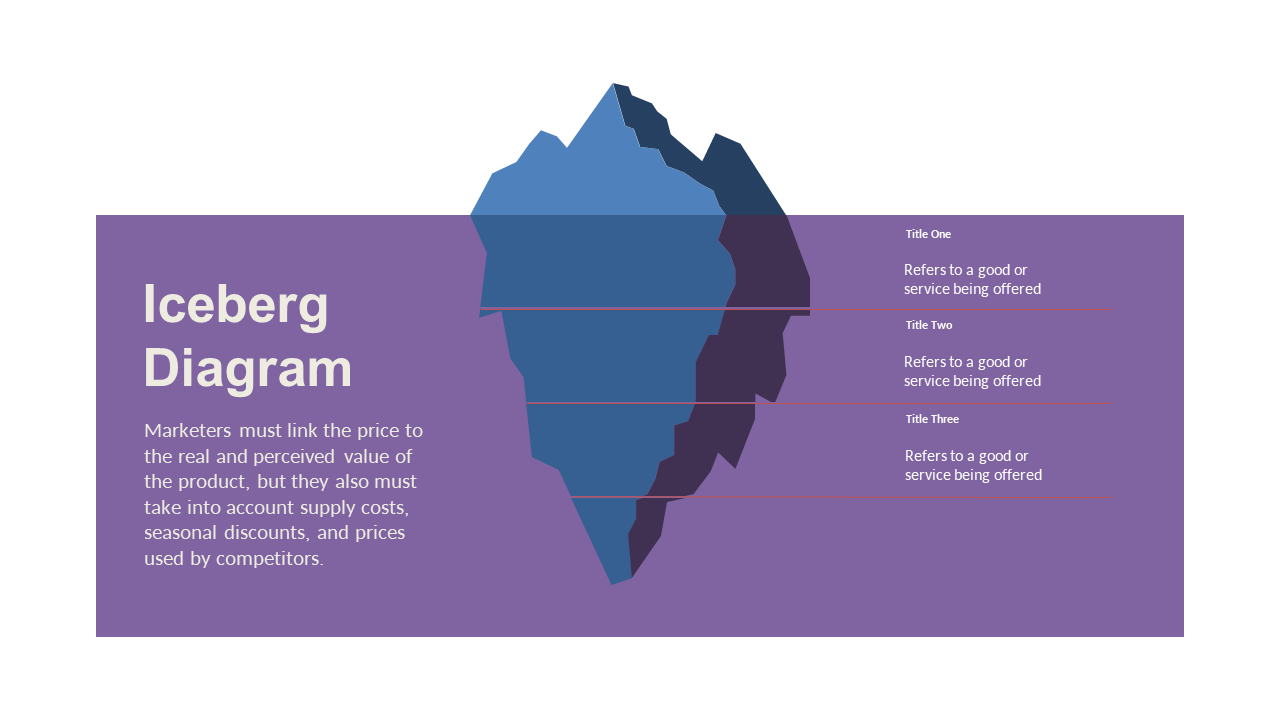
Understanding the difference between market value and perceived value is essential for any marketer. This Iceberg Diagram visually illustrates the gap between what consumers think a product is worth and its actual market value. With a clear and engaging design, this slide can help you present complex concepts effectively. As a growth marketer, you can use this slide to highlight pricing strategies that take into account consumer perspectives, competitor pricing, and supply costs. For a marketing manager, this slide can serve as a powerful tool in discussions about product positioning and value communication. If you’re a CMO, integrating this slide into your presentation can provide critical insights during strategic planning sessions. Customization is simple, allowing you to adapt colors and text to align with your brand. $0.99 — add this single slide to any deck from the SlideSwift Slide Library. No subscription needed. Mix slides from any category to build your perfect deck.
Add more from this category to your custom deck