Visualize Competitor Insights with Iceberg Diagram
Product Description
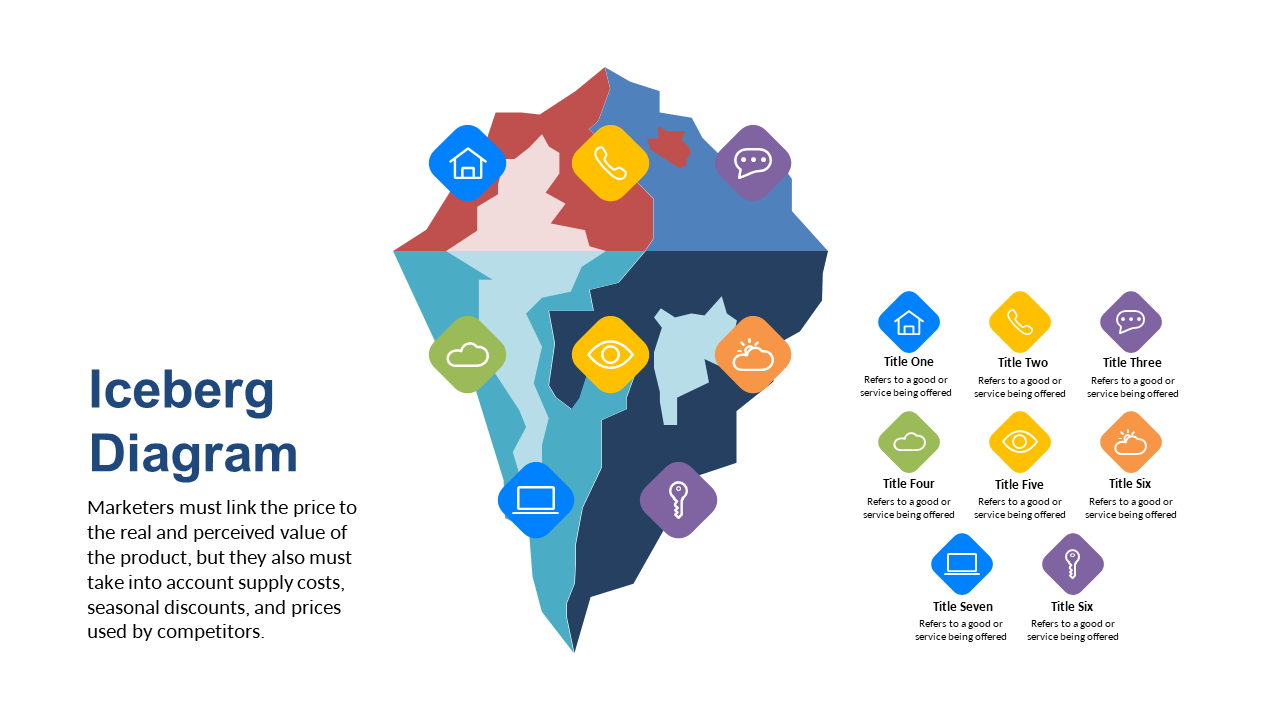
Deciphering competitor insights can feel daunting, especially when important factors are obscured beneath surface-level observations. The Iceberg Diagram simplifies this task by visually representing both obvious and hidden elements influencing competitive positioning. This clarity empowers you to discuss market dynamics with confidence.
This slide is perfect for competitive analysts and business development professionals preparing for strategy sessions or board meetings. If you’re in the tech or retail sectors, you’ll find it particularly advantageous when discussing competitor analysis or market strategies.
It’s a go-to visual aid for anyone wanting to present a clear comparison. At just $0.99, you can download this slide and customize it quickly in PowerPoint or Google Slides. It’s ready for you in minutes, enabling you to focus on your presentation without worrying about the design.
$0.99 – Purchase Checkout
Added to cart







